
The amount of methane emissions, in millions of metric
tons, from 2002 to 2008 is shown.
...

Mathematics, 01.04.2020 07:49 tagpro85
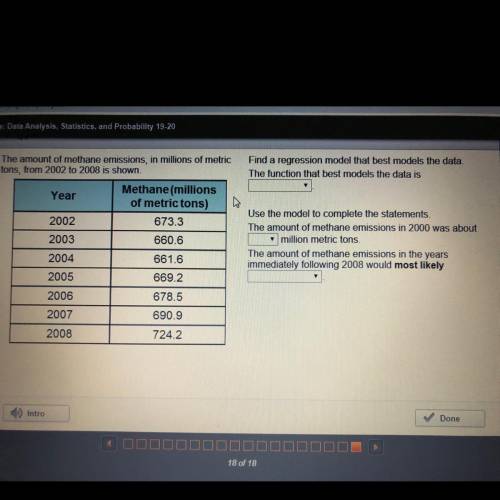
The amount of methane emissions, in millions of metric
tons, from 2002 to 2008 is shown.
Find a regression model that best models the data.
The function that best models the data is
Year
Methane (millions
of metric tons)
673.3
660.6
661.6
669.2
678.5
690.9
724.2
Use the model to complete the statements
The amount of methane emissions in 2000 was about
million metric tons
The amount of methane emissions in the years
immediately following 2008 would most likely
2002
2003
2004
2005
2006
2007
2008

Answers: 3


Other questions on the subject: Mathematics
Mathematics, 21.06.2019 12:30, Bra1nPowers
If a(0,0,0) and b(2,2,2) are points in coordinate space, how many paths are there from a to b that move from one lattice point to another in the positive x-,y- or z- direction?
Answers: 2
Mathematics, 21.06.2019 15:00, koolgurl2003
In the pendulum formula t=2pi. read the problem on the picture ! ; $; $; ! ; ! ; ! ; )$; ! ; ! ; ! ; $; $; $! ; ! ; ); $; $$
Answers: 1
Mathematics, 21.06.2019 18:30, letsbestupidcx7734
Two cyclists 84 miles apart start riding toward each other at the samen time. one cycles 2 times as fast as the other. if they meet 4 hours later what is the speed (in miles) of the faster cyclists
Answers: 2
Mathematics, 21.06.2019 19:00, ivethzurita0425
{0,1,2,3,4,5,6,20,21,22,23,24,25} the distribution is considered to be: skewed the right, skewed the left, not skewed?
Answers: 1
You know the right answer?
Questions in other subjects:

Mathematics, 27.08.2019 17:30

Chemistry, 27.08.2019 17:30

History, 27.08.2019 17:30
Biology, 27.08.2019 17:30
Mathematics, 27.08.2019 17:30


