
Mathematics, 31.03.2020 22:48 vicada2782
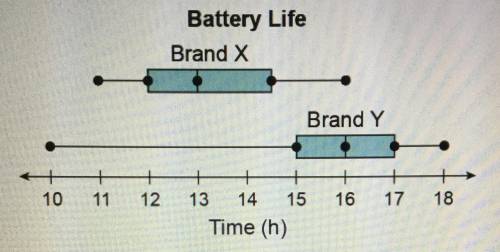
The data modeled by the box plots represent the battery life of two different brands of batteries that were tested.
(a) What is the median value of each data set?
(b) What is the range for each data set?
(c) What is the interquartile range for each data
set?
(d) Which battery would you recommend to a
friend? Explain your choice.

Answers: 2


Other questions on the subject: Mathematics
Mathematics, 21.06.2019 17:00, samantha9430
The magnitude, m, of an earthquake is defined to be m=log l/s, where i is the intensity of the earthquake (measured by the amplitude of the seismograph wave) and s is the intensity of a “standard” earthquake, which is barely detectable. what is the magnitude of an earthquake that is 1,000 times more intense than a standard earthquake? use a calculator. round your answer to the nearest tenth.
Answers: 1
Mathematics, 21.06.2019 18:00, cici170
Each month, a shopkeeper spends 5x + 14 dollars on rent and electricity. if he spends 3x−5 dollars on rent, how much does he spend on electricity? for which value(s) of x is the amount the shopkeeper spends on electricity less than $100? explain how you found the value(s).
Answers: 2
Mathematics, 21.06.2019 18:00, olivernolasco23
Solve this system of equations. 12x − 18y = 27 4x − 6y = 10
Answers: 1
You know the right answer?
The data modeled by the box plots represent the battery life of two different brands of batteries th...
Questions in other subjects:


Mathematics, 06.03.2020 19:14
Mathematics, 06.03.2020 19:14


