
Mathematics, 31.03.2020 20:32 carter283
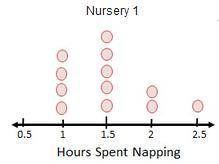
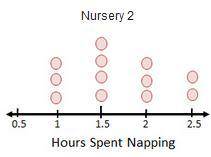
The amount of time, in hours, babies spent sleeping in two different nurseries is shown on the dot plots below.
Which describes an inference that Mrs. Hardison might make after comparing the means of the two data sets?
The babies in Nursery 1 spent more time napping.
The babies in Nursery 2 spent more time napping.
The babies in Nursery 1 had more variability in the time spent napping.
The babies in Nursery 2 had more variability in the time spent napping.

Answers: 3


Other questions on the subject: Mathematics
Mathematics, 22.06.2019 04:30, lucialovell6804
1.)solve for z. -52=-4z 2.)solve for p 9/2.3=9.2 3.)solve for y. -1.17y=5.85 4.)solve for x. 3x/8=6
Answers: 1
You know the right answer?
The amount of time, in hours, babies spent sleeping in two different nurseries is shown on the dot p...
Questions in other subjects:
Mathematics, 14.12.2020 01:20

Physics, 14.12.2020 01:20


Computers and Technology, 14.12.2020 01:20


