
Mathematics, 31.03.2020 00:27 Faizalcell2120
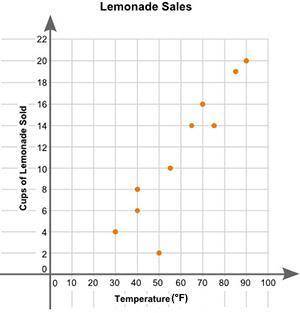
Eric plotted the graph below to show the relationship between the temperature of his city and the number of cups of lemonade he sold daily.
Part A: Describe the relationship between the temperature of the city and the number of cups of lemonade sold.
Part B: Describe how you can make the line of best fit. Write the approximate slope and y-intercept of the line of best fit. Show your work, including the points that you use to calculate the slope and y-intercept

Answers: 2


Other questions on the subject: Mathematics
Mathematics, 21.06.2019 17:20, MrSnuffleBuns4277
Closing a credit card usually _your debt ratio. a. increasesb. decreasesc. improvesd. has no effect on
Answers: 1
Mathematics, 21.06.2019 18:30, corrineikerd
41/17 as a decimal rounded to the nearest hundredth
Answers: 1
Mathematics, 21.06.2019 19:00, mandilynn22
Let hh represent the number of hummingbirds and ss represent the number of sunbirds that must pollinate the colony so it can survive until next year. 6h+4s > 746h+4s> 74 this year, 88 hummingbirds pollinated the colony. what is the least number of sunbirds that must pollinate the colony to ensure that it will survive until next year?
Answers: 1
Mathematics, 21.06.2019 19:30, sindy35111
Solve the equation for x.3(6x - 1) = 12 i've tried doing the math and i can't find out what i'm doing wrong
Answers: 1
You know the right answer?
Eric plotted the graph below to show the relationship between the temperature of his city and the nu...
Questions in other subjects:
Mathematics, 01.03.2021 01:00

Chemistry, 01.03.2021 01:00
Mathematics, 01.03.2021 01:00
Mathematics, 01.03.2021 01:00
Mathematics, 01.03.2021 01:00

Physics, 01.03.2021 01:00
Physics, 01.03.2021 01:00


