
Mathematics, 30.03.2020 21:37 danielroytman1
The plot shown below describes the relationship between students' scores on the first exam in a class and their corresponding scores on the second exam in the class. A line was fit to the data to model the relationship.
Which of these linear equations best describes the given model?
Based on this equation, estimate the score on the second exam for a student whose first exam score was 88.

Answers: 1


Other questions on the subject: Mathematics
Mathematics, 21.06.2019 15:30, MidnightYT
Find the slope of the line below . enter your answer as a fraction or decimal. use a slash mark ( / ) as the fraction bar if necessary
Answers: 1
Mathematics, 21.06.2019 17:00, landenDfisher
For the rule of 78, for a 12-month period, the last term in the sequence is 12 and the series sums to 78. for an 10 month period, the last term is and the series sum is . for a 15 month period, the last term is and the series sum is . for a 20 month period, the last term is and the series sum is
Answers: 2
You know the right answer?
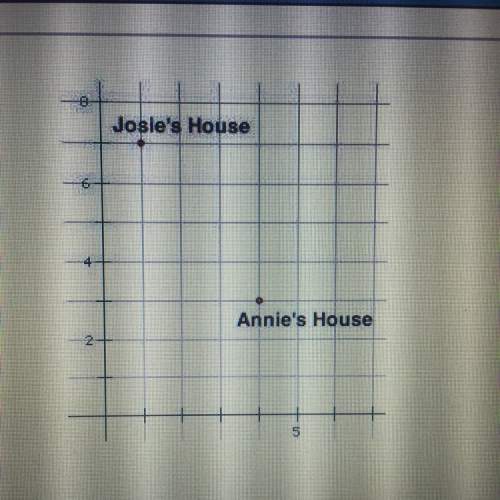
The plot shown below describes the relationship between students' scores on the first exam in a clas...
Questions in other subjects:

Biology, 24.09.2019 13:20
Biology, 24.09.2019 13:20

History, 24.09.2019 13:20

Social Studies, 24.09.2019 13:20

Mathematics, 24.09.2019 13:20
Biology, 24.09.2019 13:20


