
Mathematics, 30.03.2020 20:52 iamsecond235p318rq
Student performance across discussion sections: A professor who teaches a large introductory statistics class (197 students) with eight discussion sections would like to test if student performance differs by discussion section, where each discussion section has a different teaching assistant. The summary table below shows the average final exam score for each discussion section as well as the standard deviation of scores and the number of students in each section.
Sec 1 Sec 2 Sec 3 Sec 4 Sec 5 Sec 6 Sec 7 Sec 8
ni 33 19 10 29 33 10 32 31
Xi 92.94 91.11 91.8 92.45 89.3 88.3 90.12 93.35
si 4.21 5.58 3.43 5.92 9.32 7.27 6.93 4.57
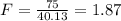
The ANOVA output below can be used to test for differences between the average scores from the different discussion sections.
Df Sum Sq Mean sq F value Pr(>F)
Section 7 525.01 75 1.87
Residuals 189 7584.11 40.13
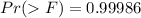
Conduct a hypothesis test to determine if these data provide convincing evidence that the average score varies across some (or all) groups. Check conditions and describe any assumptions you must make to proceed with the test.

Answers: 1
 There's no variation among the discussion sections
 There's variation among the discussion sections


Other questions on the subject: Mathematics
Mathematics, 21.06.2019 22:30, vsuescun10
For the chance to be team captain, the numbers 1-30 are put in a hat and you get two chances to pick a number, without replacement. which formula correctly shows how to find the probability that you choose the number 1 and then 2?
Answers: 1
Mathematics, 21.06.2019 23:30, xxaurorabluexx
Pleting the square f the given find the x-intercepts of the parabola with vertex (-5,13) and y-intercept (0, 12). write your answer in this form: (14,.99). if necessary, round to the nearest hundredth. *- h enter the correct answer, de verter, and ametry 00000 done doo
Answers: 2
Mathematics, 22.06.2019 00:00, bri9263
(20 points) a bank has been receiving complaints from real estate agents that their customers have been waiting too long for mortgage confirmations. the bank prides itself on its mortgage application process and decides to investigate the claims. the bank manager takes a random sample of 20 customers whose mortgage applications have been processed in the last 6 months and finds the following wait times (in days): 5, 7, 22, 4, 12, 9, 9, 14, 3, 6, 5, 15, 10, 17, 12, 10, 9, 4, 10, 13 assume that the random variable x measures the number of days a customer waits for mortgage processing at this bank, and assume that x is normally distributed. 2a. find the sample mean of this data (x ě…). 2b. find the sample variance of x. find the variance of x ě…. for (c), (d), and (e), use the appropriate t-distribution 2c. find the 90% confidence interval for the population mean (îľ). 2d. test the hypothesis that îľ is equal to 7 at the 95% confidence level. (should you do a one-tailed or two-tailed test here? ) 2e. what is the approximate p-value of this hypothesis?
Answers: 2
You know the right answer?
Student performance across discussion sections: A professor who teaches a large introductory statist...
Questions in other subjects:

Mathematics, 19.09.2019 00:00

Mathematics, 19.09.2019 00:00


