
Mathematics, 29.03.2020 20:00 hockeykid7583
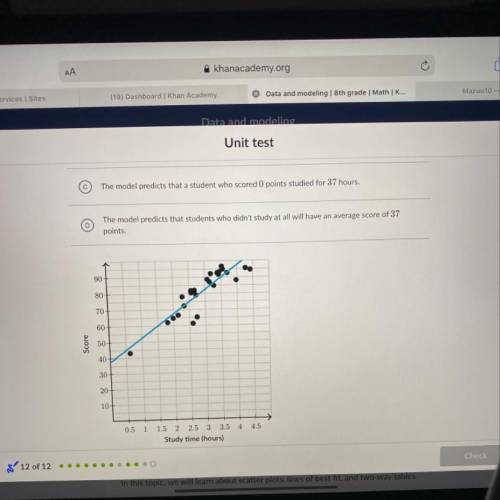
Camille's math test included a survey question asking how many hours students spent studying for the test.
The scatterplot and regression line below show the relationship between how many hours students spent
studying and their score on the test.
The nitted line has a y-intercept of 37
What is the best interpretation of this y-intercept?
A. The model predicts that the study time will increase 37 hours for each additional point scored.
B. The model predicts that the score will increase 37 points for each additional hour of study time.
C. The model predicts that a student who scored 0 points studied for 37 hours.
D. The model predicts that students who didn't study at all will have an average score of 37
points

Answers: 3


Other questions on the subject: Mathematics
Mathematics, 21.06.2019 17:00, kathiewallentin1767
Which of the following equations is of the parabola whose vertex is at (4, 3), axis of symmetry parallel to the y-axis and focus at (4, -3)? a.) y+3=1/24 (x+4)^2 b.)y-3=-1/24 (x-4)^2 c.)x-4=-1/24 (y-3)^2
Answers: 3
You know the right answer?
Camille's math test included a survey question asking how many hours students spent studying for the...
Questions in other subjects:

Mathematics, 09.05.2021 21:10
Mathematics, 09.05.2021 21:10
Chemistry, 09.05.2021 21:10

Chemistry, 09.05.2021 21:10


