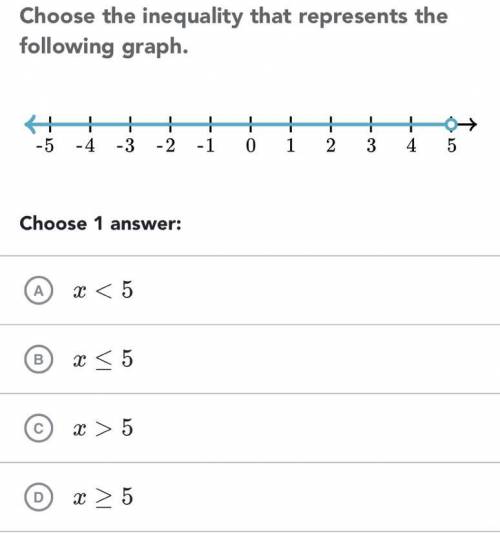
Choose the inequality that represents the following graph
...

Mathematics, 29.03.2020 04:46 ssiy
Choose the inequality that represents the following graph

Answers: 1


Other questions on the subject: Mathematics
Mathematics, 22.06.2019 05:00, madmatt873
The measures of ? 1, ? 2, and ? 3 are 40%, 12.5%, and 25% of the sum of the angle measures of the quadrilateral. find the value of x.
Answers: 3
Mathematics, 22.06.2019 07:00, levicorey846
On questions #8 and #9 don't mind my answers they're probably wrong.
Answers: 1
You know the right answer?
Questions in other subjects:

Chemistry, 12.02.2021 06:00

History, 12.02.2021 06:00

Mathematics, 12.02.2021 06:00
Mathematics, 12.02.2021 06:00
Mathematics, 12.02.2021 06:00


