The line plots show the number of hours two groups of teens spent online last week.
How d...

Mathematics, 27.03.2020 20:49 Rosalycarlite5358
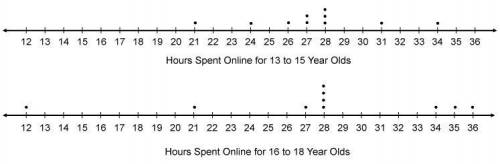
The line plots show the number of hours two groups of teens spent online last week.
How does the data compare for the two groups of teens?
The mode for the hours spent online for the 13- to 15-year olds is greater than the mode for the hours last week for the 16- to 18-year olds.
The 16- to 18-year olds spent about the same hours online, on average, as the 13- to 15-year olds.
The range of hours spent online for the 13- to 15-year olds is greater than the range of hours spent online for the 16- to 18-year olds.
The median value for the hours spent online for the 13- to 15-year olds is greater than the median value for the hours spent online for the 16- to 18- year olds.
Two dot plots titled Hours Spent Online for Thirteen to Fifteen-Year-Olds and Hours Spent Online for Sixteen to Eighteen-Year-Olds. The spread of the data is different in both plots.

Answers: 1


Other questions on the subject: Mathematics
Mathematics, 21.06.2019 21:50, elsauceomotho
Which value of y will make the inequality y< -1 false?
Answers: 2
Mathematics, 22.06.2019 00:00, destinywashere101
Last week jason walked 3 1/4 miles each day for 3 days and 4 5/8 miles each day for 4 days. about how many miles did jason walk last week?
Answers: 1
You know the right answer?
Questions in other subjects:

History, 21.09.2019 20:30

Physics, 21.09.2019 20:30


Computers and Technology, 21.09.2019 20:30
History, 21.09.2019 20:30
Mathematics, 21.09.2019 20:30


Geography, 21.09.2019 20:30


