
Mathematics, 27.03.2020 14:14 chancho3703
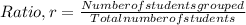
The table shows the year groups of some students who use the canteen. Mr Ford wants to survey 50 of these students stratified by year group. How many more year 9 students than year 8 students should be in the survey?


Answers: 2


Other questions on the subject: Mathematics
Mathematics, 21.06.2019 20:00, chantelljenkins2
True or false: the graph of y=f(bx) is a horizontal compression of the graph y=f(x) if b< 1
Answers: 2
Mathematics, 21.06.2019 20:30, cheating53
Kayaks rent for $35 per day. which expression can you use to find the cost in dollars of renting 3 kayaks for a day?
Answers: 1
Mathematics, 21.06.2019 21:50, gwendallinesikes
Ab and bc are tangent to circle d. find x is ab = 3x + 8 and bc = 26. find x
Answers: 1
Mathematics, 22.06.2019 01:00, s27511583
The weight of 46 new patients of a clinic from the year 2018 are recorded and listed below. construct a frequency distribution, using 7 classes. then, draw a histogram, a frequency polygon, and an ogive for the data, using the relative information from the frequency table for each of the graphs. describe the shape of the histogram. data set: 130 192 145 97 100 122 210 132 107 95 210 128 193 208 118 196 130 178 187 240 90 126 98 194 115 212 110 225 187 133 220 218 110 104 201 120 183 124 261 270 108 160 203 210 191 180 1) complete the frequency distribution table below (add as many rows as needed): - class limits - class boundaries - midpoint - frequency - cumulative frequency 2) histogram 3) frequency polygon 4) ogive
Answers: 1
You know the right answer?
The table shows the year groups of some students who use the canteen. Mr Ford wants to survey 50 of...
Questions in other subjects:


History, 01.09.2020 23:01
History, 01.09.2020 23:01


Health, 01.09.2020 23:01


