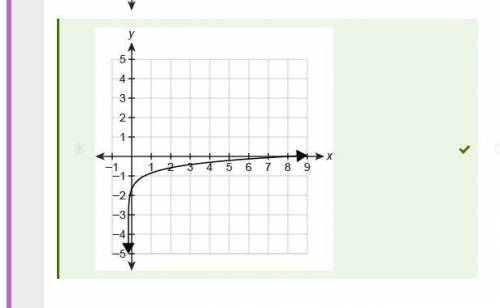
Which graph represents the logarithmic function?
y= log (12x+ 2) - 2...

Mathematics, 27.03.2020 09:19 dnee8321
Which graph represents the logarithmic function?
y= log (12x+ 2) - 2

Answers: 2


Other questions on the subject: Mathematics
Mathematics, 21.06.2019 18:30, joaquin42
Which of the statements about the graph of the function y = 2x are true? check all of the boxes that apply. the domain is all real numbers x because the exponent of 2 can be any real number when the x-values increases by 1 unit, the y-value multiplies by 2. the y-intercept is (0, 1). the graph never goes below the x-axis because powers of 2 are never negative. the range is all real numbers.
Answers: 1
Mathematics, 21.06.2019 20:30, AllanCasey12
Angles r and s are complementary. the measure of angle r is 31 degrees. which equation can be used to find angle s?
Answers: 1
Mathematics, 21.06.2019 20:30, velazquezemmy45
Aswimming pool measures 22ft by 12ft and is 4ft deep. if the pool is being filled at 2.5 cubic ft per minute, how long will it take to fill the pool?
Answers: 1
You know the right answer?
Questions in other subjects:


Chemistry, 11.05.2021 02:00
English, 11.05.2021 02:00


