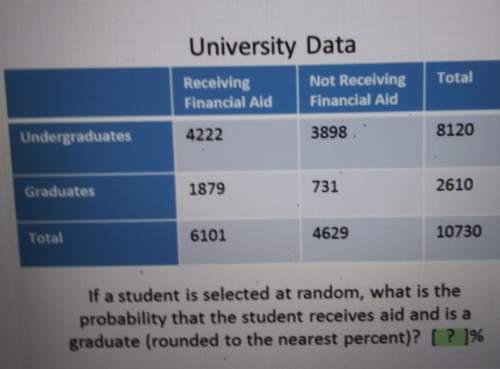
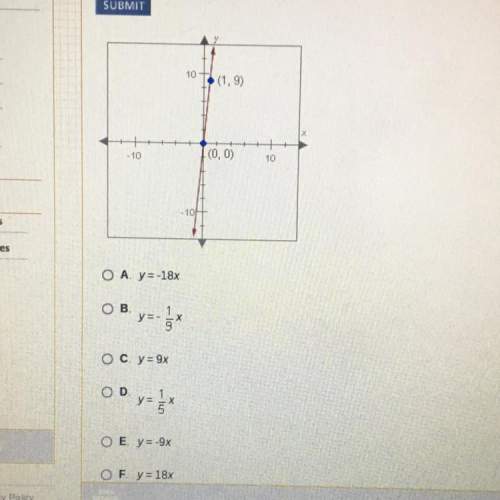
The graph of f(x)=x^2 is shown.
Use the parabola tool to graph g(x).
g(x)=(...

Mathematics, 26.03.2020 22:02 ChikiChu
The graph of f(x)=x^2 is shown.
Use the parabola tool to graph g(x).
g(x)=(x+2)^2−1
Graph the parabola by first plotting its vertex and then plotting a second point on the parabola.

Answers: 3


Other questions on the subject: Mathematics
Mathematics, 21.06.2019 13:00, smithcj0505
)a smart phone has dimensions of 4.9 inches (height), 2.3 inches (width) and 8.0 millimeters (depth). what is the volume of the smart phone in cubic centimeters? (1 in = 2.54 cm)
Answers: 1
Mathematics, 21.06.2019 23:30, honwismun1127
Which statements are true about box plots? check all that apply. they describe sets of data. they include the mean. they show the data split into four parts. they show outliers through really short “whiskers.” each section of a box plot represents 25% of the data.
Answers: 3
Mathematics, 21.06.2019 23:30, kaziyahf2006
Which two fractions are equivalent to 6/11? 6/22 and 18/33 12/22 and 18/33 12/22 and 18/22 3/5 and 6/10
Answers: 1
You know the right answer?
Questions in other subjects:
Mathematics, 09.12.2020 16:40

Mathematics, 09.12.2020 16:40
Mathematics, 09.12.2020 16:40


Biology, 09.12.2020 16:40

Spanish, 09.12.2020 16:40


