AYUDA PORFAVOR!
Tienes que obtener la ecuación de la recta a partir de los datos que se o...

Mathematics, 26.03.2020 17:49 gshreya2005
AYUDA PORFAVOR!
Tienes que obtener la ecuación de la recta a partir de los datos que se ofrecen y dejar la solución
final en la forma y = mx + n.
1) Halla la ecuación de la recta que pasa por los puntos P (-3, 2) y Q (2, -1).
2) Halla la ecuación de la recta que pasa por los puntos P (-1, 0) y Q (0, 3).
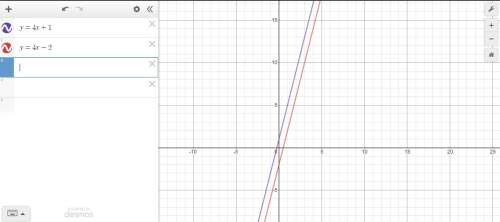
3) Halla la ecuación de la recta que tiene pendiente 4 y pasa por Q (0, -2).
4) Representante en un mismo gráfico las 3 rectas obtenidas

Answers: 2


Other questions on the subject: Mathematics
Mathematics, 21.06.2019 17:10, ivilkas23
The frequency table shows a set of data collected by a doctor for adult patients who were diagnosed with a strain of influenza. patients with influenza age range number of sick patients 25 to 29 30 to 34 35 to 39 40 to 45 which dot plot could represent the same data as the frequency table? patients with flu
Answers: 2
Mathematics, 21.06.2019 18:10, heavenwagner
which of the following sets of data would produce the largest value for an independent-measures t statistic? the two sample means are 10 and 20 with variances of 20 and 25 the two sample means are 10 and 20 with variances of 120 and 125 the two sample means are 10 and 12 with sample variances of 20 and 25 the two sample means are 10 and 12 with variances of 120 and 125
Answers: 2
Mathematics, 22.06.2019 01:30, kayolaaaa53
If two lines form congruent alternate interior angles with a transversal, then the lines
Answers: 2
You know the right answer?
Questions in other subjects:
Mathematics, 01.12.2021 20:30

Biology, 01.12.2021 20:30


Mathematics, 01.12.2021 20:30

History, 01.12.2021 20:30
Mathematics, 01.12.2021 20:30


