
Mathematics, 26.03.2020 09:17 hlhunter11p8f0o0
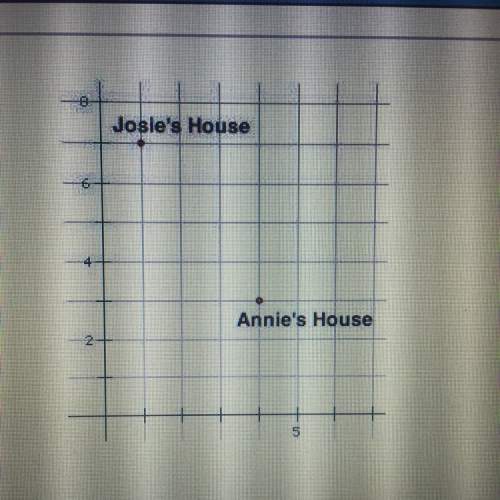
The data on the graph show the foot lengths and forearm lengths for a group of people. The line of best fit for
the data is shown. Use the equation of the line of best fit to predict the length of a person's forearm if the length
of their foot is 8 inches.

Answers: 1


Other questions on the subject: Mathematics
Mathematics, 21.06.2019 20:00, chantelljenkins2
True or false: the graph of y=f(bx) is a horizontal compression of the graph y=f(x) if b< 1
Answers: 2
Mathematics, 21.06.2019 22:30, ondreabyes225pcr83r
Adistribution has the five-number summary shown below. what is the third quartile, q3, of this distribution? 22, 34, 41, 55, 62
Answers: 2
You know the right answer?
The data on the graph show the foot lengths and forearm lengths for a group of people. The line of b...
Questions in other subjects:


Geography, 23.07.2019 10:20

Health, 23.07.2019 10:20

Business, 23.07.2019 10:20
Business, 23.07.2019 10:20

Computers and Technology, 23.07.2019 10:20


