
Mathematics, 25.03.2020 21:51 malikthomas
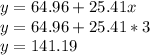
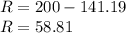
In the Fall STA 2023 Beginning of the Semester Survey, students were asked how many parties they attended every week and how many text messages they sent per day. The researcher decided to make the number of parties attended per week the explanatory variable and the number of text messages sent per day the response variable. The least squares regression line for this relationship is y-hat = 64.96 + 25.41x. One student attended 3 parties that week and sent 200 text messages per day. What is the residual?
A.58.81
B.-106.63
C.5146.96
D.4946.96
E.96.63
F.-96.63

Answers: 2


Other questions on the subject: Mathematics
Mathematics, 21.06.2019 14:30, hardwick744
How do the graphs of y = 1/x and y=5/x+6 compare?
Answers: 2
Mathematics, 21.06.2019 17:00, michibabiee
Sole with work in 10 years, the average number of hours of tv watched per week by teenagers dropped from 23.9 to 21.4. find the percent of change.
Answers: 1
Mathematics, 22.06.2019 03:30, ambercuevas2707
Would love some on this! include step by step have a good day!
Answers: 1
You know the right answer?
In the Fall STA 2023 Beginning of the Semester Survey, students were asked how many parties they att...
Questions in other subjects:


Mathematics, 21.02.2020 21:25


Biology, 21.02.2020 21:25

Chemistry, 21.02.2020 21:25


