PLEASE HELP!
Match each given function with the description of its graph.
y-intercep...

Mathematics, 25.03.2020 20:41 lankfordcrystal81
PLEASE HELP!
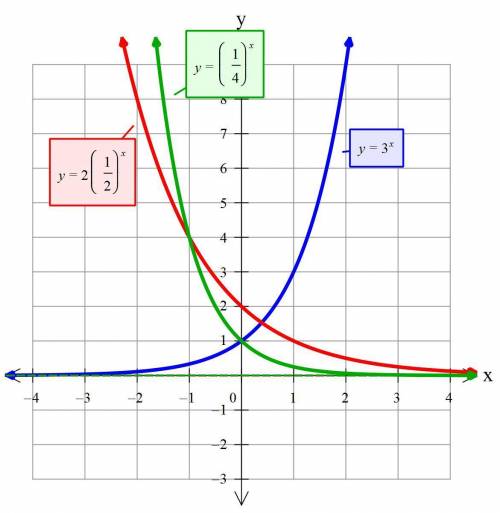
Match each given function with the description of its graph.
y-intercept at (0, 2)
graph initially decreases rapidly and then decreases slowly
y-intercept at (0, 2)
graph initially decreases slowly and then decreases rapidly
y-intercept at (0, 1)
graph initially decreases rapidly and then decreases slowly
y-intercept at (0, 1)
graph initially increases rapidly and then increases slowly
y-intercept at (0, 1)
graph initially increases slowly and then increases rapidly
y = 3^x
y = 2(1/2)^x
y = (1/4)^x

Answers: 3


Other questions on the subject: Mathematics
Mathematics, 21.06.2019 15:00, Shavaila18
The data shown in the table below represents the weight, in pounds, of a little girl, recorded each year on her birthday. age (in years) weight (in pounds) 2 32 6 47 7 51 4 40 5 43 3 38 8 60 1 23 part a: create a scatter plot to represent the data shown above. sketch the line of best fit. label at least three specific points on the graph that the line passes through. also include the correct labels on the x-axis and y-axis. part b: algebraically write the equation of the best fit line in slope-intercept form. include all of your calculations in your final answer. part c: use the equation for the line of best fit to approximate the weight of the little girl at an age of 14 years old.
Answers: 3
Mathematics, 21.06.2019 20:00, dbn4everloved
Anyone? 15m is what percent of 60m; 3m; 30m; 1.5 km?
Answers: 1
You know the right answer?
Questions in other subjects:


Law, 18.10.2020 14:01

Chemistry, 18.10.2020 14:01

Social Studies, 18.10.2020 14:01
Mathematics, 18.10.2020 14:01

English, 18.10.2020 14:01
English, 18.10.2020 14:01


