
Mathematics, 24.03.2020 17:56 ggjhuvth
Rolling blackouts have become a way of life in many major cities around the world. With electrical demand far outstripping production, grid operators have come to rely on this systematic means of keeping the distribution system from experiencing complete failure. In one city, the blackout schedule has each region without power on average 2.5 hours per day. The standard deviation of blackout times in this city is 0.31 hours. A local hospital in the area purchases a generator that will provide power to nonessential systems for 3.5 hours. If the blackout times follow a normal distribution, what percentage of time will the hospital find themselves without power to these nonessential systems

Answers: 1

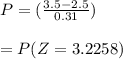
![[NORMSDIST(3.2258)]\\\\= 0.9994\\\\= 94.99%](/tpl/images/0561/0121/0b159.png)


Other questions on the subject: Mathematics
Mathematics, 21.06.2019 16:00, sharondot2398
Sam makes his sales calls according to a pattern. he travels either north or south depending on the calendar. some of his past trips were as follows: on february 17, april 24, june 10, september 19, and november 3 he drove north. on february 28, may 25, august 22, november 20, and december 18, he drove south. describe sams' pattern. in which direction will sam drive on oct4 and oct 24?
Answers: 1
Mathematics, 21.06.2019 16:50, catdog5225
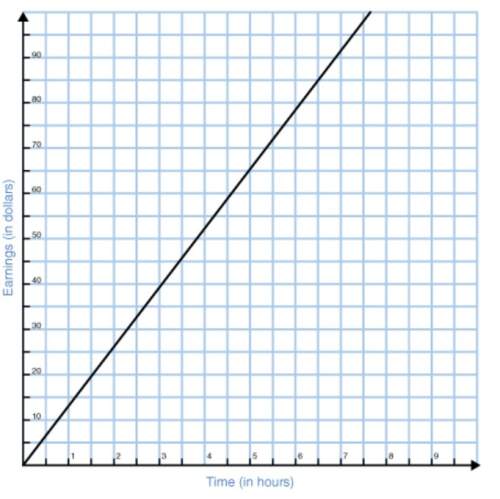
The table represents a linear function. what is the slope of the function? –6 –4 4 6
Answers: 3
Mathematics, 21.06.2019 19:30, cykopath
Me max recorded the heights of 500 male humans. he found that the heights were normally distributed around a mean of 177 centimeters. which statements about max’s data must be true? a) the median of max’s data is 250 b) more than half of the data points max recorded were 177 centimeters. c) a data point chosen at random is as likely to be above the mean as it is to be below the mean. d) every height within three standard deviations of the mean is equally likely to be chosen if a data point is selected at random.
Answers: 2
Mathematics, 21.06.2019 19:30, tgentryb60
Now max recorded the heights of 500 male humans. he found that the heights were normally distributed around a mean of 177 centimeters. which statements about max’s data must be true? a) the median of max’s data is 250 b) more than half of the data points max recorded were 177 centimeters. c) a data point chosen at random is as likely to be above the mean as it is to be below the mean. d) every height within three standard deviations of the mean is equally likely to be chosen if a data point is selected at random.
Answers: 1
You know the right answer?
Rolling blackouts have become a way of life in many major cities around the world. With electrical d...
Questions in other subjects:

Mathematics, 03.04.2020 19:55


Chemistry, 03.04.2020 19:56


