
Mathematics, 23.03.2020 04:04 pizzalover6994
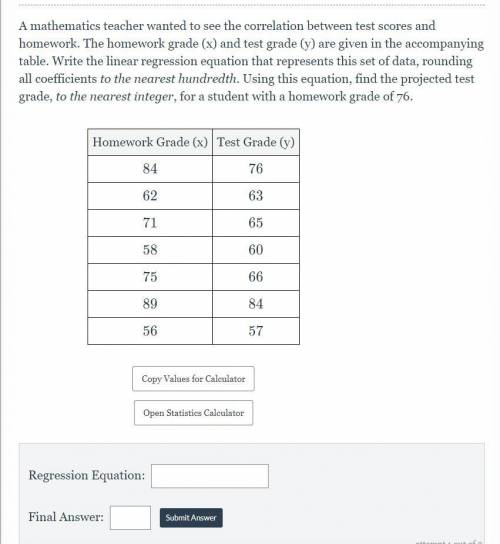
A mathematics teacher wanted to see the correlation between test scores and homework. The homework grade (x) and test grade (y) are given in the accompanying table. Write the linear regression equation that represents this set of data, rounding all coefficients to the nearest hundredth. Using this equation, find the projected test grade, to the nearest integer, for a student with a homework grade of 76.

Answers: 1


Other questions on the subject: Mathematics
Mathematics, 21.06.2019 17:00, uuuugggghhhh2463
At the beginning of the day, stock xyz opened at $6.12. at the end of the day, it closed at $6.88. what is the rate of change of stock xyz? a. 1.17% b. 11.0% c. 12.4% d. 81.5%
Answers: 1
Mathematics, 21.06.2019 21:30, kimlyn58p0wyn0
The price of a dozen eggs was $1.63. suppose the price increases m dollars per dozen and then the price decreases $0.12 per dozen. which expression represents the current price of eggs after the two price changes?
Answers: 1
Mathematics, 21.06.2019 23:30, alexandramendez0616
Hich equation can pair with x + 2y = 5 to create an inconsistent system? 2x + 4y = 3 5x + 2y = 3 6x + 12y = 30 3x + 4y = 8
Answers: 3
You know the right answer?
A mathematics teacher wanted to see the correlation between test scores and homework. The homework g...
Questions in other subjects:


Business, 10.03.2020 20:29

Mathematics, 10.03.2020 20:30

Mathematics, 10.03.2020 20:30


