
Mathematics, 21.03.2020 03:00 ponyolovezsosuk1074
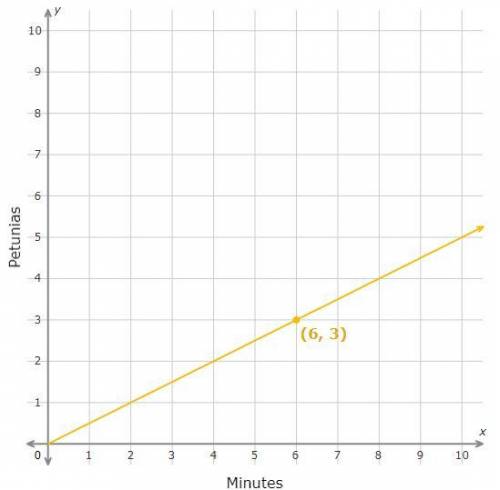
Every spring, Marvin plants colorful flowers in his garden. This year, he decides to plant petunias. He buys them at the garden store, brings them back home, and starts planting.
The graph shows the proportional relationship between the amount of time (in minutes) Marvin has been working in his garden, x, and the number of petunias he has planted, y.
What does the point (6,3) represent?


Answers: 1


Other questions on the subject: Mathematics
Mathematics, 21.06.2019 18:00, duplerk30919
What is the difference between the predicted value and the actual value
Answers: 1
Mathematics, 21.06.2019 23:30, honwismun1127
Which statements are true about box plots? check all that apply. they describe sets of data. they include the mean. they show the data split into four parts. they show outliers through really short “whiskers.” each section of a box plot represents 25% of the data.
Answers: 3
You know the right answer?
Every spring, Marvin plants colorful flowers in his garden. This year, he decides to plant petunias....
Questions in other subjects:

History, 05.09.2019 01:30
Mathematics, 05.09.2019 01:30


Geography, 05.09.2019 01:30

Mathematics, 05.09.2019 01:30

Mathematics, 05.09.2019 01:30


