
Mathematics, 20.03.2020 18:28 rrusso4
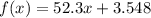
A study analyzed the average yearly salt intake in the United States from 2012 thru 2017. The data is summarized in the table: Year Annual Salt Intake (grams) 2012 3,554 2013 3,598 2014 3,603 2015 3,655 2016 3,718 2017 3,794 The study found that the data after the year 2012 can be modeled by the function f(x) = 52.3x + 3,548, where x is the number of years since 2012 and f(x) is the total amount of salt ingested in grams. Describe the significance of 3,548. An estimate of the average grams of salt used in 2012 An estimate of the average grams of salt used in 2013 The average amount of salt in grams used in 2012 The average amount of salt in grams used in 2013

Answers: 3


Other questions on the subject: Mathematics
Mathematics, 21.06.2019 14:20, blakemccain1928
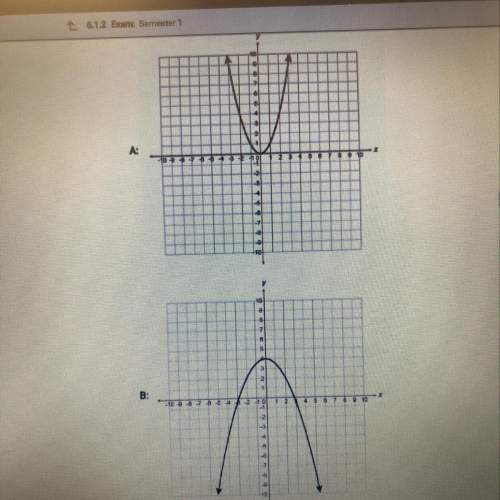
Which linear inequality is represented by the graph? !
Answers: 2
Mathematics, 21.06.2019 18:30, Greekfreak
To determine the number of deer in a forest a forest ranger tags 280 and releases them back
Answers: 3
Mathematics, 21.06.2019 19:00, rodriguezzamyy
There is an entrance to the computer room at point e which lies on ab and is 5 feet from point a. plot point e on the coordinate plane. find the distance from the entrance at point e to the printer at point e
Answers: 1
You know the right answer?
A study analyzed the average yearly salt intake in the United States from 2012 thru 2017. The data i...
Questions in other subjects:

Business, 12.12.2020 15:50

Mathematics, 12.12.2020 15:50

Mathematics, 12.12.2020 15:50


Biology, 12.12.2020 15:50
Mathematics, 12.12.2020 15:50

Chemistry, 12.12.2020 15:50


