
Mathematics, 19.03.2020 22:32 squadfam2024
The histogram below shows information about the number of hamburgers students ate in a month: A histogram is titled Hamburgers Eaten Monthly, the horizontal axis is labeled Hamburgers, and the vertical axis is labeled Students. The range on the horizontal axis is 0 to 4, 5 to 9, and 10 to 14. The values on the vertical axis are from 0 to 10 at intervals of 1. The first bin goes to 8, the second bin to 3, the third bin to 2. Which information is provided in the histogram? (4 points) Group of answer choices The mean number of hamburgers eaten The median number of hamburgers eaten The number of students who ate 5 hamburgers or fewer The number of students who ate 10 hamburgers or more

Answers: 3


Other questions on the subject: Mathematics
Mathematics, 21.06.2019 17:10, tdahna0403
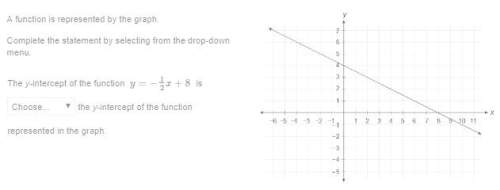
The graph of g(x) is a translation of y = which equation represents g(x)?
Answers: 1
Mathematics, 21.06.2019 18:00, dlaskey646
The swimming pool is open when the high temperature is higher than 20∘c. lainey tried to swim on monday and thursday (which was 3 days later). the pool was open on monday, but it was closed on thursday. the high temperature was 30∘c on monday, but decreased at a constant rate in the next 3 days. write an inequality to determine the rate of temperature decrease in degrees celsius per day, d, from monday to thursday.
Answers: 1
You know the right answer?
The histogram below shows information about the number of hamburgers students ate in a month: A hist...
Questions in other subjects:

Mathematics, 06.10.2019 17:50


Biology, 06.10.2019 17:50


