 We want to find the average rate of change of change of the given function from x=1 to x=4.

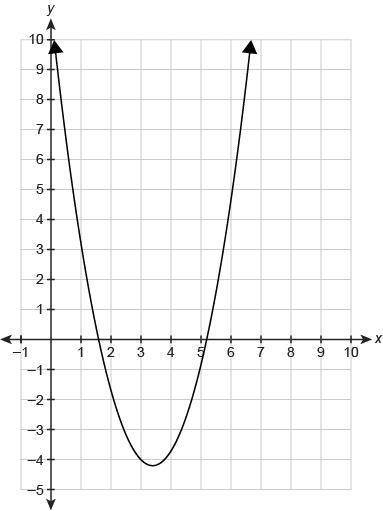
The graph shows the function f(x).
Which value is closest to the average rate of change...

Mathematics, 18.03.2020 17:24 miranda3837
The graph shows the function f(x).
Which value is closest to the average rate of change from x = 1 to x = 4?
a. −3.5
b. −2.3
c. −1.4
d. −0.3

Answers: 3


Other questions on the subject: Mathematics
Mathematics, 21.06.2019 20:30, AdanNava699
If you are dealt 4 cards from a shuffled deck of 52? cards, find the probability that all 4 cards are diamondsdiamonds.
Answers: 1
You know the right answer?
Questions in other subjects:
Mathematics, 19.01.2020 00:31

Mathematics, 19.01.2020 00:31
English, 19.01.2020 00:31
Mathematics, 19.01.2020 00:31


