
Mathematics, 18.03.2020 07:01 krizzle168
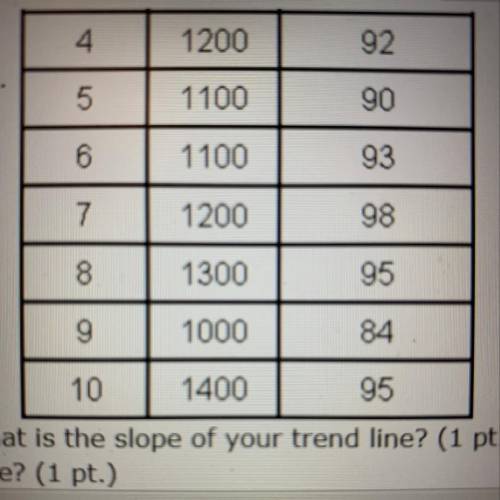
You have collected data on 10 seniors at your high school to determine if SAT scores can help predict success in the calculus course. Construct a scatter plot if this data and draw a trend line.
A. Is the data correlation positive, negative or no correlation?
B. What is the slope of your trend line?
C. What is the equation for your trend line?
D. If you have 1150 on your SAT, what do you predict your final score in calculus to be?

Answers: 2


Other questions on the subject: Mathematics
Mathematics, 21.06.2019 18:00, Jingobob442
Asquare has a perimeter of sixteen centimeters. what is the length of each of its sides? a. 8 cm c. 9 cm b. 4 cm d. 10 cm select the best answer from the choices
Answers: 2
Mathematics, 21.06.2019 23:30, blueval3tine
Sally deposited money into a savings account paying 4% simple interest per year. the first year, she earn $75 in interest. how much interest will she earn during the following year?
Answers: 1
Mathematics, 22.06.2019 04:30, magiflores6122
The table shows the distances travelled by a paper aeroplane. a. find the range and interquartile range of the data. the range is feet. the interquartile range is __feet. b. interpret the range and interquartile range of the data. __ feet the distances travelled by the paper aeroplane varied by no more than__ feet. the middle half of the distances travelled by the paper aeroplane varied by no more than __ feet.
Answers: 1
You know the right answer?
You have collected data on 10 seniors at your high school to determine if SAT scores can help predic...
Questions in other subjects:

Geography, 05.09.2020 14:01


Geography, 05.09.2020 14:01


