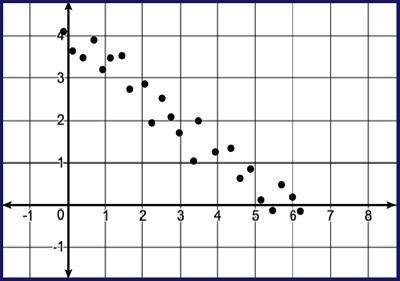
Determine the equation for the line of best fit to represent the data.
scatter plot with...

Mathematics, 17.03.2020 22:18 superkitty003
Determine the equation for the line of best fit to represent the data.
scatter plot with points going down from about zero comma 4 to the right to about 7 comma zero
y equals two thirds times x plus 4
y equals negative two thirds times x plus 4
y equals negative three halves times x plus 4
y equals negative two thirds times x minus 4

Answers: 3


Other questions on the subject: Mathematics
Mathematics, 21.06.2019 18:00, Jingobob442
Asquare has a perimeter of sixteen centimeters. what is the length of each of its sides? a. 8 cm c. 9 cm b. 4 cm d. 10 cm select the best answer from the choices
Answers: 2
You know the right answer?
Questions in other subjects:

Mathematics, 12.03.2021 04:00


Spanish, 12.03.2021 04:00
Mathematics, 12.03.2021 04:00


