Mrs. Hans buys a house for $150,000. The value of the house is expected to increase at a
rate...

Mathematics, 17.03.2020 19:47 angelalovelis
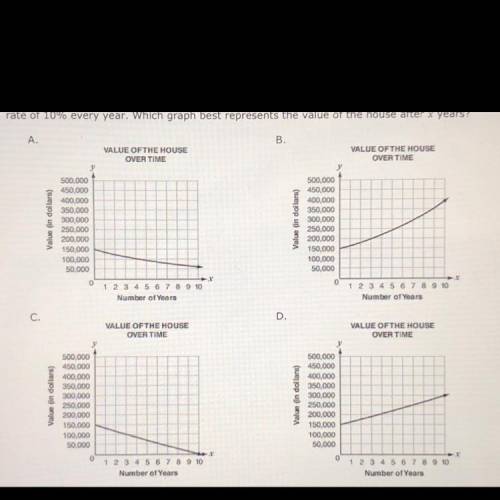
Mrs. Hans buys a house for $150,000. The value of the house is expected to increase at a
rate of 10% every year. Which graph best represents the value of the house after x years?
Select one of the answers given in the picture please!!❤️

Answers: 3


Other questions on the subject: Mathematics
Mathematics, 21.06.2019 16:10, rajene9302
On new year's day, the average temperature of a city is 5.7 degrees celsius. but for new year's day 2012, the temperature was 9.8 degrees below the average. i) if a represents the average temperature on new year's day and 7 represents the temperature on new year's day 2012, what formula accurately relates the two values together? ii) what was the temperature on new year's day 2012? dt a 0.8 ii) - 4 1 degrees celsius da-t-98 ii) 59 degrees celsius 1) 7 = -9,8 11) 59 degrees celsius ii) l degrees celsius
Answers: 2
Mathematics, 21.06.2019 23:00, mindofnyny
In triangle △abc, ∠abc=90°, bh is an altitude. find the missing lengths. ac=26 and ch=8, find bh.
Answers: 3
You know the right answer?
Questions in other subjects:
Mathematics, 08.06.2021 18:50
Mathematics, 08.06.2021 18:50

Chemistry, 08.06.2021 18:50

English, 08.06.2021 18:50

Mathematics, 08.06.2021 18:50

History, 08.06.2021 18:50

Mathematics, 08.06.2021 18:50


