
Mathematics, 17.03.2020 18:23 jessicachichelnitsky
A sample of 200 ROM computer chips was selected on each of 30 consecutive days, and the number of nonconforming chips on each day was as follows: 8, 19, 27, 17, 38, 18, 4, 27, 9, 22, 30, 17, 14, 23, 15, 14, 12, 20, 13, 18, 14, 20, 9, 27, 30, 13, 10, 19, 12, 26. Construct a p chart and examine it for any out-of-control points. (Round your answers to four decimal places.)
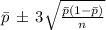
p =
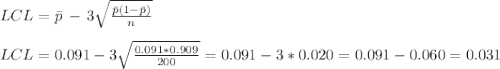
LCL =
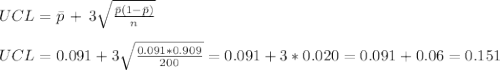
UCL=
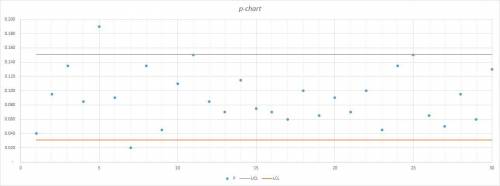
Comment on the chart.
The value of s on the 5th day lies below the LCL, so an out-of-control signal is generated.
The value of s on the 5th day lies above the UCL, so an out-of-control signal is generated.
Most points are between these limits, so the process appears to be in control with respect to variability.
All points are between these limits, so the process appears to be in control.
All points are between these limits, so the process appears to be out of control.

Answers: 2


Other questions on the subject: Mathematics
Mathematics, 21.06.2019 23:30, pinkygirlp1662
The triangle shown has a hypotenuse with a length of 13 feet. the measure of angle a is 20 degrees. and the measure of angle b is 70 degrees. which of the following is closest to the length, in feet, of line segment ac? no need to use a calculator to find the trig numbers. each function is listed below. 4.4 5 12.2 35.7
Answers: 2
You know the right answer?
A sample of 200 ROM computer chips was selected on each of 30 consecutive days, and the number of no...
Questions in other subjects:


English, 15.02.2020 04:04


Advanced Placement (AP), 15.02.2020 04:06


