
Mathematics, 17.03.2020 04:08 maddie6825
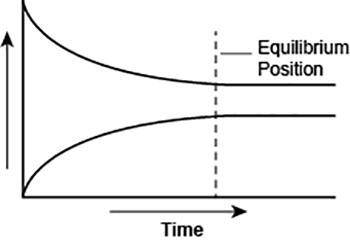
A student made a graph plotting the progress of a reaction over time. The student forgot to label the y-axis of the graph.
What best explains the label that the student should use on the y-axis?
A. Amount, because as the amount of product decreases, the amount of reactant increases over time.
B. Reaction rate, because forward and backward reaction become equal at equilibrium.
C. Amount, because the amounts of reactants and products become constant after equilibrium is reached.
D. Reaction rate, as the rate of forward reaction increases and rate of backward reaction decreases over time.

Answers: 3


Other questions on the subject: Mathematics
Mathematics, 21.06.2019 15:00, kylemartinez13
What is the multiplicative rate of change of the exponential function shown on the graph?
Answers: 2
Mathematics, 21.06.2019 22:40, winterblanco
Use this graph to find the cost of 6 show tickets
Answers: 1
Mathematics, 21.06.2019 23:30, honwismun1127
Which statements are true about box plots? check all that apply. they describe sets of data. they include the mean. they show the data split into four parts. they show outliers through really short “whiskers.” each section of a box plot represents 25% of the data.
Answers: 3
You know the right answer?
A student made a graph plotting the progress of a reaction over time. The student forgot to label th...
Questions in other subjects:


Mathematics, 02.02.2022 07:40

History, 02.02.2022 07:40

Chemistry, 02.02.2022 07:40
Biology, 02.02.2022 07:40


