
Mathematics, 16.03.2020 21:20 ThePotato381
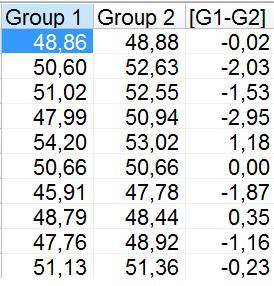
Consider the following data set. The data were actually collected in pairs, and each row represents a pair.
Group 1 Group 2
48.86 48.88
50.6 52.63
51.02 52.55
47.99 50.94
54.2 53.02
50.66 50.66
45.91 47.78
48.79 48.44
47.76 48.92
51.13 51.63
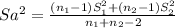
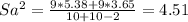
a. Suppose that we ignore the fact that the data were collected in pairs and mistakenly treat this as a two-sample problem. Compute the sample mean and variance for each group. Then compute the two-sample t statistic, degrees of freedom, and P-value for the two-sided alternative.
b. Now analyze the data in the proper way. Compute the sample mean and variance of the differences. Then compute the t statistic, degrees of freedom, and P-value.
c. Describe the differences in the two test results.

Answers: 2
![t=\frac{(X[bar]_1-X[bar]_2)-(Mu_1-Mu_2)}{Sa\sqrt{\frac{1}{n_1} +\frac{1}{n_2} } } ~~t_{n_1+n_2-2}](/tpl/images/0549/2049/5828a.png)
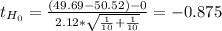
 ≤-0.875) + P(
![t= \frac{X[bar]d-Mud}{\frac{Sd}{\sqrt{n} } } ~~t_{n-1}](/tpl/images/0549/2049/7de66.png)
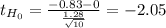
 ≤-2.05) + P(
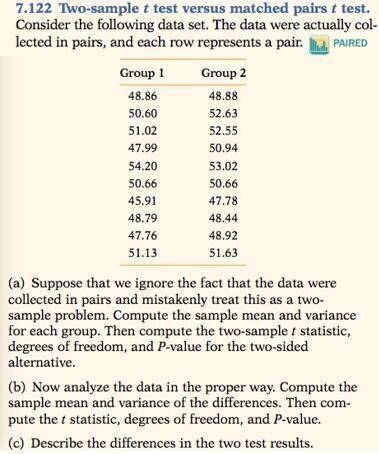


Other questions on the subject: Mathematics
Mathematics, 21.06.2019 20:00, helplessstudent3
You are shooting hoops after school and make 152 out of a total of 200. what percent of shots did you make? what percent did you miss? show proportion(s).
Answers: 1
You know the right answer?
Consider the following data set. The data were actually collected in pairs, and each row represents...
Questions in other subjects:

Engineering, 07.09.2021 06:00
Mathematics, 07.09.2021 06:00

Social Studies, 07.09.2021 06:00
Mathematics, 07.09.2021 06:00


