The graph below shows the relationship between two variables.
Which scenario is best re...

Mathematics, 13.03.2020 23:58 thunder42
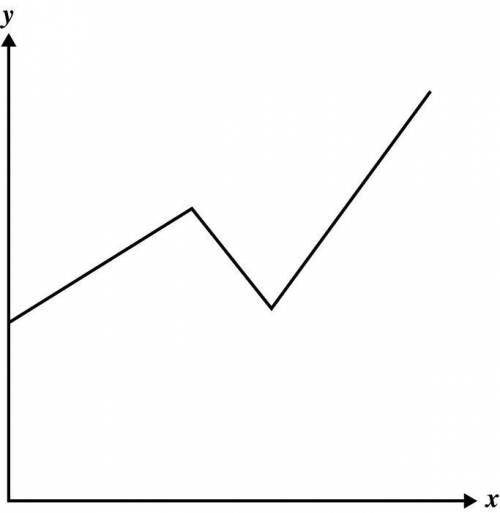
The graph below shows the relationship between two variables.
Which scenario is best represented by the graph?
David drove at a constant speed before slowing down in a school zone. He then increased the speed of his car.
The number of perfect test scores by students in a math class increased from the first to the second grading period and then began to decline.
After a period of slow growth, the height of a plant remained the same for 2 weeks. It was then fertilized and began to rapidly increase in height.
The number of employees at a store increased at a constant rate for 5 years. There was a decrease in the number of employees for 2 years. Then the number of employees increased at a greater constant rate for the next few years.

Answers: 3


Other questions on the subject: Mathematics
Mathematics, 21.06.2019 18:10, TrueMonster8911
What is the equation in slope-intercept form of the linear function represented by the table? y -18 -1 -8 4 2 912 o y=-2x-6 o y=-2x+6 o y=2x-6 o y = 2x+6
Answers: 1
Mathematics, 21.06.2019 19:30, LordYoshee8676
Julian wrote the following numeric pattern on the board3,10,17,24,31,38.what numbers of julian's pattern are compound numbers.
Answers: 2
Mathematics, 21.06.2019 19:40, michaellangley
Molly shared a spool of ribbon with 12 people. each person received 3 feet of ribbon. which equation can she use to find r, the number of feet of ribbon that her spool originally had?
Answers: 1
You know the right answer?
Questions in other subjects:

Mathematics, 10.05.2021 19:00


