
Mathematics, 13.03.2020 22:04 jamaicalove2880
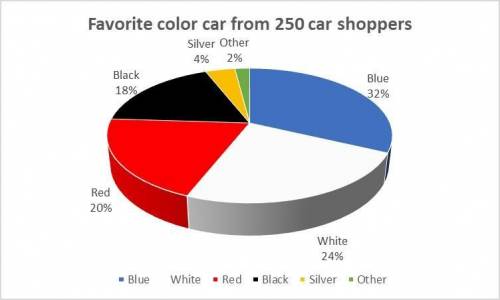
1. A researcher collected data from car shoppers about their favorite car color. He asked 250 people about their favorite vehicle color and the survey revealed the following: 32% said blue, 24% said white, 20% said red, 18% said black, and 4% said silver.
(a) What percent preferred a color other than blue, white, red, black, or silver?
(3 pts: 2 for answer, 1 for showing work)
(b) How many more people said their favorite color is white compared to those who said black? (3 pts – 2 for answer, 1 for showing work)
(c) Draw and label a circle graph showing the responses to the survey. Be sure to include a section for “Other”. Be sure your circle graph is labeled, and the percentages are in proportion to the whole. (2 pts – 1 for correctly showing percentages and 1 for labeling)

Answers: 2


Other questions on the subject: Mathematics
Mathematics, 21.06.2019 21:30, barb4you67
Hey hotel charges guests $19.75 a day to rent five video games at this rate which expression can be used to determine the charge for renting nine video games for one day at this hotel? pls
Answers: 1
Mathematics, 22.06.2019 04:00, repirce9141
3. simplify. 312⋅312 4. rewrite n√xm using a rational expression.
Answers: 1
You know the right answer?
1. A researcher collected data from car shoppers about their favorite car color. He asked 250 people...
Questions in other subjects:


