Which graph below is a tree graph?
...

Mathematics, 12.03.2020 22:05 alexusray
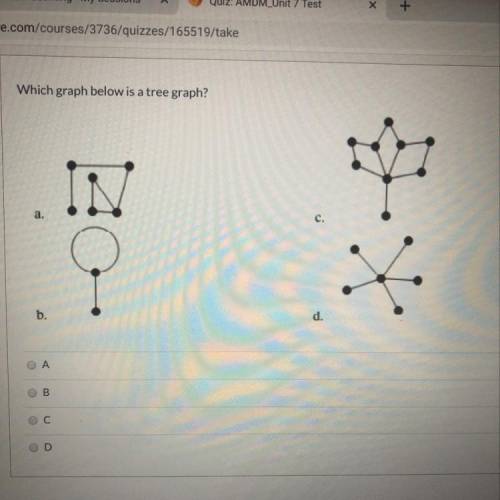
Which graph below is a tree graph?

Answers: 3


Other questions on the subject: Mathematics
Mathematics, 20.06.2019 18:04, darrenmcfadden220
Super ultra mega important if you can answer this correctly i will give you 100 points but if you don't answer it correctly you'll get a big report. so stay aware and have a nice day!
Answers: 1
Mathematics, 21.06.2019 23:00, freebyyy7032
Unaware that 35% of the 10000 voters in his constituency support him, a politician decides to estimate his political strength. a sample of 200 voters shows that 40% support him. a. what is the population? b. what is the parameter of interest? state its value c. what is the statistics of the interest? state its value d. compare your answers in (b) and (c) is it surprising they are different? if the politician were to sample another 200 voters, which of the two numbers would most likely change? explain
Answers: 2
You know the right answer?
Questions in other subjects:

Arts, 15.12.2020 01:00


Social Studies, 15.12.2020 01:00

Business, 15.12.2020 01:00
Social Studies, 15.12.2020 01:00


