
Mathematics, 12.03.2020 07:06 kovacscsilla55owjvhn
A random sample of 600 adults is taken from a population of over one million, in order to compute a con dence interval for a proportion. If the researchers wanted to decrease the width of the con dence interval, they could A. increase the size of the sample. B. decrease the size of the population. C. increase the size of the population. D. decrease the size of the sample.

Answers: 3
 : sample mean
 .
. , and a confidence level of
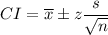
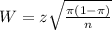
  , we have the following confidence interval of proportions.
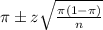
 .
.


Other questions on the subject: Mathematics
Mathematics, 21.06.2019 14:00, zoeyanai1
30 in the diagram line e and made parallel to each other and line p and q are transversal. use properties of special angles formed by parallel lines and their transversals to find the missing angle measures. m< 3=65 m< 15=120 m< 7= m< 4= m< 6= m< 1= m< 16= m< 18= m< 21= m< 10= m< 11= m< 12=
Answers: 1
Mathematics, 21.06.2019 14:00, Gheaton1889
Find the length of cu, the triangles are similar.
Answers: 2
Mathematics, 21.06.2019 16:00, kell22wolf
Part one: measurements 1. measure your own height and arm span (from finger-tip to finger-tip) in inches. you will likely need some from a parent, guardian, or sibling to get accurate measurements. record your measurements on the "data record" document. use the "data record" to you complete part two of this project. name relationship to student x height in inches y arm span in inches archie dad 72 72 ginelle mom 65 66 sarah sister 64 65 meleah sister 66 3/4 67 rachel sister 53 1/2 53 emily auntie 66 1/2 66 hannah myself 66 1/2 69 part two: representation of data with plots 1. using graphing software of your choice, create a scatter plot of your data. predict the line of best fit, and sketch it on your graph. part three: the line of best fit include your scatter plot and the answers to the following questions in your word processing document 1. 1. which variable did you plot on the x-axis, and which variable did you plot on the y-axis? explain why you assigned the variables in that way. 2. write the equation of the line of best fit using the slope-intercept formula $y = mx + b$. show all your work, including the points used to determine the slope and how the equation was determined. 3. what does the slope of the line represent within the context of your graph? what does the y-intercept represent? 5. use the line of best fit to you to describe the data correlation.
Answers: 2
Mathematics, 21.06.2019 18:30, letsbestupidcx7734
Two cyclists 84 miles apart start riding toward each other at the samen time. one cycles 2 times as fast as the other. if they meet 4 hours later what is the speed (in miles) of the faster cyclists
Answers: 2
You know the right answer?
A random sample of 600 adults is taken from a population of over one million, in order to compute a...
Questions in other subjects:

Mathematics, 03.07.2021 23:30


Social Studies, 03.07.2021 23:30


Computers and Technology, 03.07.2021 23:30


