C. Analyze the given box-and-whisker plot, which displays the heights of 40 randomly chosen
ad...

Mathematics, 12.03.2020 02:57 ilovefood2064
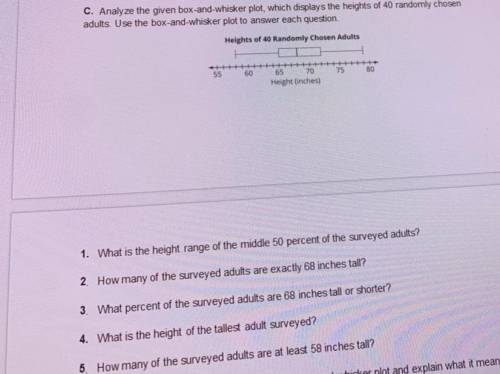
C. Analyze the given box-and-whisker plot, which displays the heights of 40 randomly chosen
adults. Use the box-and-whisker plot to answer each question.
Heights of 40 Randomly Chosen Adults
+
1. What is the height range of the middle 50 percent of the surveyed adults?
2. How many of the surveyed adults are exactly 68 inches tall?
3. What percent of the surveyed adults are 68 inches tall or shorter?
4. What is the height of the tallest adult surveyed?
5. How many of the surveyed adults are at least 58 inches tall?
6. Describe the distribution of the data in the box-and-whisker plot and explain what it means in
terms of the problem situation

Answers: 1


Other questions on the subject: Mathematics
Mathematics, 21.06.2019 23:40, ozzypurple05
For a function f(x), a) if f(7) = 22 then f^-1(22) = b) f^-1(f(c)) =
Answers: 2
Mathematics, 22.06.2019 04:30, shanekamayo1120
In which month was the peak, the largest deposit, made? january june july august
Answers: 1
You know the right answer?
Questions in other subjects:
Mathematics, 23.10.2021 08:50


History, 23.10.2021 08:50

English, 23.10.2021 08:50

Chemistry, 23.10.2021 08:50


