Which statement correctly describes the data shown in the scatter plot?
The point (2, 14...

Mathematics, 11.03.2020 21:30 chessacs2950
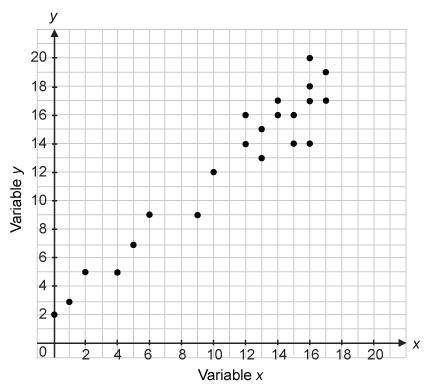
Which statement correctly describes the data shown in the scatter plot?
The point (2, 14) is an outlier.
The scatter plot shows no association.
The scatter plot shows a negative association.
The scatter plot shows a linear association.

Answers: 2


Other questions on the subject: Mathematics
Mathematics, 21.06.2019 18:00, TGJuuzouSuzuya
!! 10 ! a westbound jet leaves central airport traveling 635 miles per hour. at the same time, an eastbound plane departs at 325 miles per hour. in how many hours will the planes be 1900 miles apart?
Answers: 1
Mathematics, 22.06.2019 02:00, mathhelppls14
1. the manager of collins import autos believes the number of cars sold in a day (q) depends on two factors: (1) the number of hours the dealership is open (h) and (2) the number of salespersons working that day (s). after collecting data for two months (53 days), the manager estimates the following log-linear model: q 4 equation 1 a. explain, how to transform the log-linear model into linear form that can be estimated using multiple regression analysis. the computer output for the multiple regression analysis is shown below: q4 table b. how do you interpret coefficients b and c? if the dealership increases the number of salespersons by 20%, what will be the percentage increase in daily sales? c. test the overall model for statistical significance at the 5% significance level. d. what percent of the total variation in daily auto sales is explained by this equation? what could you suggest to increase this percentage? e. test the intercept for statistical significance at the 5% level of significance. if h and s both equal 0, are sales expected to be 0? explain why or why not? f. test the estimated coefficient b for statistical significance. if the dealership decreases its hours of operation by 10%, what is the expected impact on daily sales?
Answers: 2
Mathematics, 22.06.2019 03:00, IntellTanito
Select quivalent or not equivalent to indicate whether the expression above is equivalent or not equivalent to the values or expressions in the last column.
Answers: 3
You know the right answer?
Questions in other subjects:

Mathematics, 24.08.2019 21:30

Chemistry, 24.08.2019 21:30
Chemistry, 24.08.2019 21:30
Mathematics, 24.08.2019 21:30
Mathematics, 24.08.2019 21:30


