Identify the transformation that maps the figure onto itself
A)
Reflect across the line...

Mathematics, 11.03.2020 19:05 tseaux9
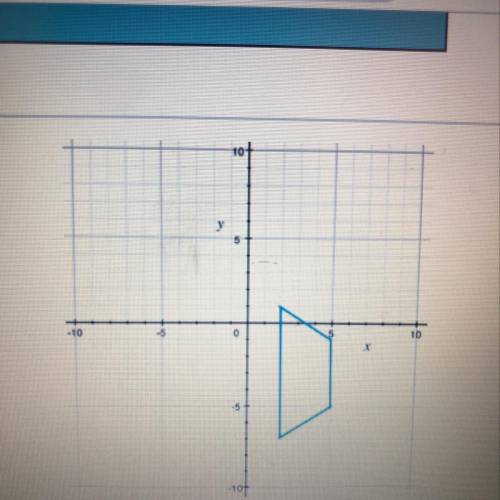
Identify the transformation that maps the figure onto itself
A)
Reflect across the line y = -3
B)
Reflect across the line x = 3
Rotate 180° about the point (3-5)
D)
Rotate 180 about the point (5.5)
Can some one plz help

Answers: 1


Other questions on the subject: Mathematics
Mathematics, 21.06.2019 22:00, harry5112
Acaterer charges $500 plus $30 per guest to cater a wedding. walt and traci don't want to spend more than $8000 on catering. write and solve an inequality in terms of the number of guests, g, that can be invited. a) 30g ? 8000; g ? 267 b) 500g < 8000; g < 16 c) 500 + 30g < 8000; g < 250 d) 500 + 30g ? 8000; g ? 250
Answers: 1
Mathematics, 21.06.2019 22:00, blythephillips2734
Benjamin is making bow ties. how many 1/2yards lomg bow ties can he make if he has 18 feet of fabric?
Answers: 2
Mathematics, 22.06.2019 02:00, mathhelppls14
1. the manager of collins import autos believes the number of cars sold in a day (q) depends on two factors: (1) the number of hours the dealership is open (h) and (2) the number of salespersons working that day (s). after collecting data for two months (53 days), the manager estimates the following log-linear model: q 4 equation 1 a. explain, how to transform the log-linear model into linear form that can be estimated using multiple regression analysis. the computer output for the multiple regression analysis is shown below: q4 table b. how do you interpret coefficients b and c? if the dealership increases the number of salespersons by 20%, what will be the percentage increase in daily sales? c. test the overall model for statistical significance at the 5% significance level. d. what percent of the total variation in daily auto sales is explained by this equation? what could you suggest to increase this percentage? e. test the intercept for statistical significance at the 5% level of significance. if h and s both equal 0, are sales expected to be 0? explain why or why not? f. test the estimated coefficient b for statistical significance. if the dealership decreases its hours of operation by 10%, what is the expected impact on daily sales?
Answers: 2
You know the right answer?
Questions in other subjects:

History, 24.09.2020 14:01
Mathematics, 24.09.2020 14:01
Mathematics, 24.09.2020 14:01
Mathematics, 24.09.2020 14:01


