
Mathematics, 11.03.2020 17:57 HyperZ
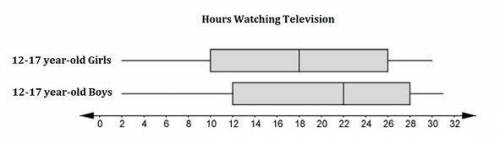
Consider the graphs which summarize the data on the number of hours per week of television viewing by two groups: 12-17 year-old Girls and 12-17 year-old Boys.
Choose all that are correct.
The median for the girls is 16.
The median for the boys is 22.
The interquartile range for the girls is 28
The interquartile range for the boys is 16
The difference between the medians as a multiple of the IQR is 1/4

Answers: 2


Other questions on the subject: Mathematics
Mathematics, 21.06.2019 21:00, annikafischer
Askateboard ramp is in the shape of a right triangle what is the height of the ramp
Answers: 3
Mathematics, 21.06.2019 21:30, sassy11111515
Cal's go cart has a gas tank with the dimensions shown below. he uses a gas can that holds 11 gallon of gas, to fill the go cart tank. 11 gallon = 231 inches^3 how many full gas cans will it take to fill the go cart's gas tank?
Answers: 3
You know the right answer?
Consider the graphs which summarize the data on the number of hours per week of television viewing b...
Questions in other subjects:

English, 09.12.2019 22:31
Mathematics, 09.12.2019 22:31
Mathematics, 09.12.2019 22:31


Computers and Technology, 09.12.2019 22:31

Geography, 09.12.2019 22:31


