
Mathematics, 11.03.2020 02:40 lhmsokol56
The distribution of heights of adult men in the U. S. is approximately normal with mean 69 inches and standard deviation 2.5 inches. Use what you know about the empirical formula?1. About what % of men are taller than 74 inches?
2. Approx. what percent of men are taller than 69 inches?3. Approx what percent of men are between 69 and 74 inches?

Answers: 1
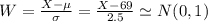
 the cummulative distribution function of W. The values of


Other questions on the subject: Mathematics
Mathematics, 21.06.2019 14:00, kah36
When drawing a trend line for a series of data on a scatter plot, which of the following is true? a. there should be an equal number of data points on either side of the trend line. b. all the data points should lie on one side of the trend line. c. the trend line should not intersect any data point on the plot. d. the trend line must connect each data point on the plot.
Answers: 2
You know the right answer?
The distribution of heights of adult men in the U. S. is approximately normal with mean 69 inches an...
Questions in other subjects:


