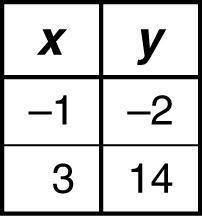
The table of values represents a linear function.
Which graph appears to have a line tha...

Mathematics, 11.03.2020 02:51 Banana2819
The table of values represents a linear function.
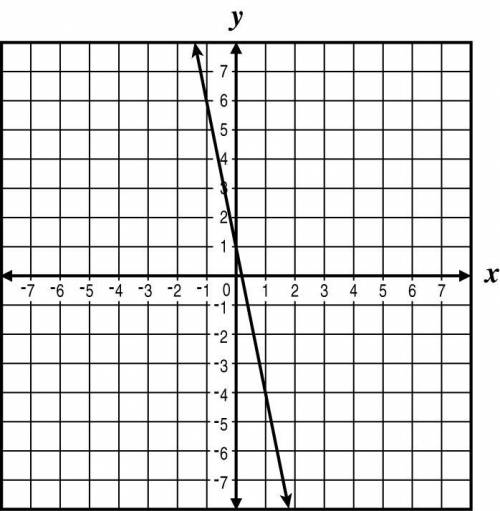
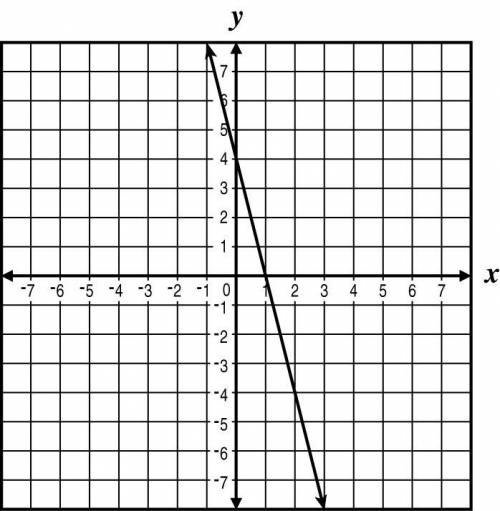
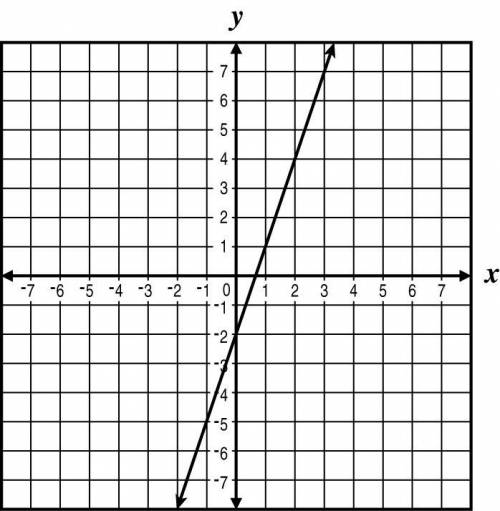
Which graph appears to have a line that is steeper than the line represented by the table of values?


Answers: 2


Other questions on the subject: Mathematics
Mathematics, 21.06.2019 14:10, evalentine843
Olivia uses the work below to determine 55% of 720 which explains the error in olivia’s solution
Answers: 1
Mathematics, 21.06.2019 16:30, xojade
The weights of players in a basketball league are distributed normally. the distance (d) of each player's weight (w) from the mean of 86 kilograms was computed as follows: d = |w - 86| if d is greater than 7 for approximately 5% of the players, what is the approximate standard deviation of the players' weights? a. 1.75 kilograms b. 3.5 kilograms c. 4.3 kilograms d. 7 kilograms
Answers: 3
Mathematics, 22.06.2019 00:30, steviedude316
Round each of the decimals to the nearest hundredth a. 0.596 b. 4.245 c. 53.6843 d. 17.999
Answers: 2
You know the right answer?
Questions in other subjects:


Social Studies, 31.01.2022 07:20
Mathematics, 31.01.2022 07:20


Mathematics, 31.01.2022 07:20


