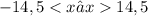
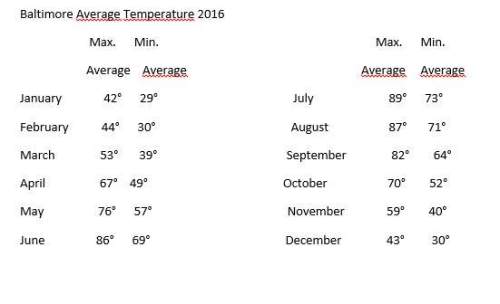
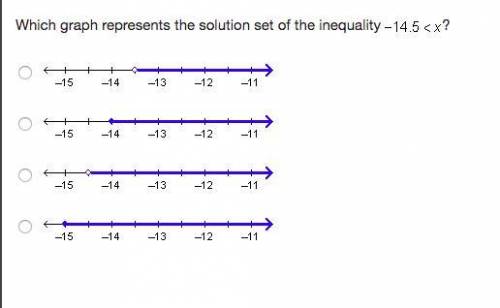
Which graph represents the solution set of the inequality ? -14.5
...

Mathematics, 10.03.2020 20:21 WritingStar1313
Which graph represents the solution set of the inequality ? -14.5

Answers: 2


Other questions on the subject: Mathematics
Mathematics, 22.06.2019 01:10, onlymyworld27
To find the inverse of a number a, one can use the equation f(c) = a-1/c=0 where c is the inverse of a use the secant method of finding roots of equations to find the inverse of a = 2.5 ,er = 0.001%
Answers: 3
Mathematics, 22.06.2019 05:30, Justtrynapassclass
Ablueberry plant produces about 26 blueberries per day. if the farmer picked 472 blueberries, how many days did the plants produce blueberries?
Answers: 1
You know the right answer?
Questions in other subjects:
Mathematics, 18.12.2020 17:20


Biology, 18.12.2020 17:20


