![r=\frac{n(\sum xy)-(\sum x)(\sum y)}{\sqrt{[n\sum x^2 -(\sum x)^2][n\sum y^2 -(\sum y)^2]}}](/tpl/images/0541/2302/ec454.png)

![r=\frac{10(330.0321)-(75.81948)(43.5231)}{\sqrt{[10(574.8598) -(75.819)^2][10(192.8274) -(43.5231)^2]}}=0.989](/tpl/images/0541/2302/c7336.png)
![r=\frac{10(330.0321)-(75.81948)(43.5231)}{\sqrt{[10(574.8598) -(75.81948)^2][10(192.8274) -(43.5231)^2]}}=0.989](/tpl/images/0541/2302/07d17.png)
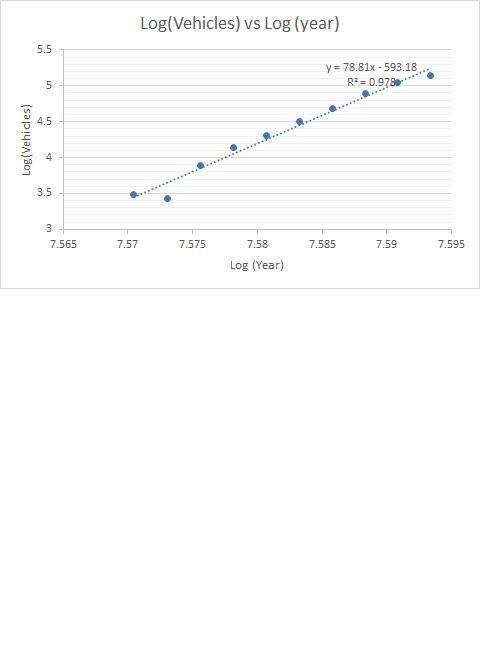
The number of motor vehicles registered in millions in the US has grown as follows:
Year...

Mathematics, 10.03.2020 18:56 tysongraham5232
The number of motor vehicles registered in millions in the US has grown as follows:
Year: 1940, 1945 1950, 1955, 1960, 1965, 1970, 1975, 1980, 1985
Vehicles: 32.4, 31.0, 49.2, 62.7, 73.9, 90.4, 108.4, 132.9, 155.8, 171.7
(Where Year = X and Vehicles = Y)
Use logarithms to transform the data into a linear association. White the equation of the LSRL. Your answer should have logs in it. Remember to define any variables.
a. Present a scatter plot for the data. (Hint: let x = 0 represent the year 1940)
b. Determine the correlation coefficient for the data and interpret the value.

Answers: 3


Other questions on the subject: Mathematics
Mathematics, 22.06.2019 00:30, katherineedwards1105
Jan accidently ran 7 minutes longer than he was supposed to. write an expression for the total amount of time jan ran if she was supposed to run m minutes
Answers: 1
Mathematics, 22.06.2019 00:30, Jazzy4real
Jaxon has s packs of 8 crazy straws. he divided the crazy straws into 2 equal bags. now, he has 224 crazy straws in each bag. how many packs of crazy straws did jaxon start with?
Answers: 1
You know the right answer?
Questions in other subjects:
Mathematics, 14.02.2021 02:20

History, 14.02.2021 02:20


History, 14.02.2021 02:20
Mathematics, 14.02.2021 02:20
Mathematics, 14.02.2021 02:20


