
Mathematics, 10.03.2020 09:00 xgibson123
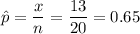
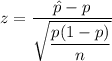
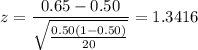
You would like to determine if more than 50% of the observations in a population are below 10. At α = 0.05, conduct the test on the basis of the following 20 sample observations: 8 12 5 9 14 11 12 6 8 9 2 6 11 9 3 7 8 4 13 10 Calculate the sample proportion.

Answers: 2


Other questions on the subject: Mathematics
Mathematics, 21.06.2019 17:30, SethSimunek
Choose the number sentence that shows the identity property of addition. a. 122 = 61 + 61 b. 62 = 1 + 61 c. 61 = 0 + 61
Answers: 1
Mathematics, 21.06.2019 21:40, Blakemiller2020
Which of the following best describes the graph below? + + 2 + 3 + 4 1 o a. it is not a function. o b. it is a one-to-one function. o c. it is a many-to-one function. o d. it is a function, but it is not one-to-one.
Answers: 3
Mathematics, 22.06.2019 02:00, mathhelppls14
1. the manager of collins import autos believes the number of cars sold in a day (q) depends on two factors: (1) the number of hours the dealership is open (h) and (2) the number of salespersons working that day (s). after collecting data for two months (53 days), the manager estimates the following log-linear model: q 4 equation 1 a. explain, how to transform the log-linear model into linear form that can be estimated using multiple regression analysis. the computer output for the multiple regression analysis is shown below: q4 table b. how do you interpret coefficients b and c? if the dealership increases the number of salespersons by 20%, what will be the percentage increase in daily sales? c. test the overall model for statistical significance at the 5% significance level. d. what percent of the total variation in daily auto sales is explained by this equation? what could you suggest to increase this percentage? e. test the intercept for statistical significance at the 5% level of significance. if h and s both equal 0, are sales expected to be 0? explain why or why not? f. test the estimated coefficient b for statistical significance. if the dealership decreases its hours of operation by 10%, what is the expected impact on daily sales?
Answers: 2
You know the right answer?
You would like to determine if more than 50% of the observations in a population are below 10. At α...
Questions in other subjects:
Mathematics, 22.04.2020 03:54

History, 22.04.2020 03:54


