
Mathematics, 10.03.2020 07:39 irlShadow
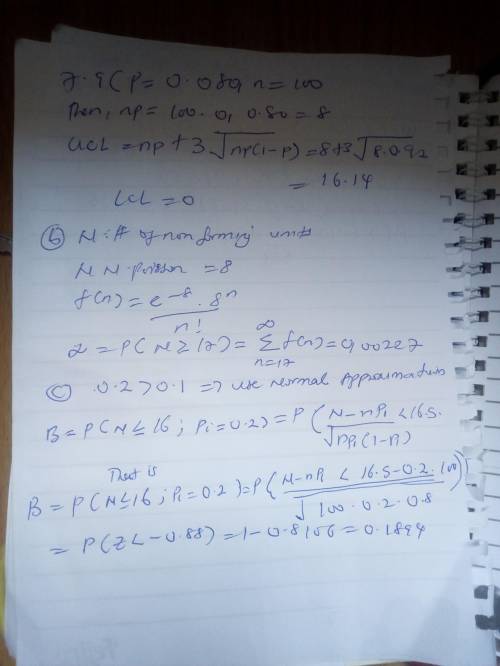
A process is controlled with a fraction nonconforming control chart with three-sigma limits, n = 100, UCL = 0.161, center line = 0.080, and LCL = 0.
a. Find the equivalent control chart for the number nonconforming.
b. Use the Poisson approximation to the binomial to find the probability of a type I error.
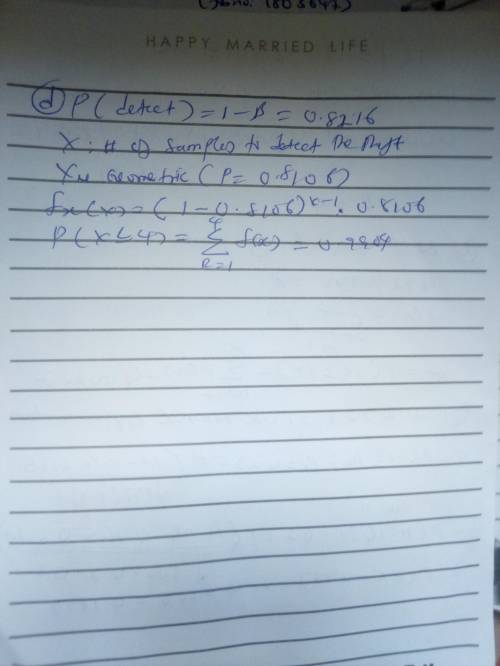
c. Use the normal approximation to binomial to find the probability of a type II error if the process fraction nonconforming shifts to 0.2.
d. What is the probability of detecting the shift in part (c) by at most the fourth sample after the shift?

Answers: 2


Other questions on the subject: Mathematics
Mathematics, 21.06.2019 12:30, qxchung7310
Elijah and his sister went to the movies. they had $34 altogether and spent $9.50 per ticket. elijah and his sister bought the same snacks. write and solve an inequality fotlr the amount that each person spent on snacks. interpret the solition
Answers: 3
Mathematics, 22.06.2019 03:30, alaina05
The volume of a rectangular prism is found by multiplying the length, width, and height of the prism. a rectangular prism has a width of 5x^2units, a length of 7x^3 units and a height of 2x^4 units. which is the volume of the prism in terms of x?
Answers: 1
You know the right answer?
A process is controlled with a fraction nonconforming control chart with three-sigma limits, n = 100...
Questions in other subjects:

English, 07.12.2020 23:30
Mathematics, 07.12.2020 23:30
Engineering, 07.12.2020 23:30
English, 07.12.2020 23:30


History, 07.12.2020 23:30


