
Mathematics, 10.03.2020 02:09 bailee37
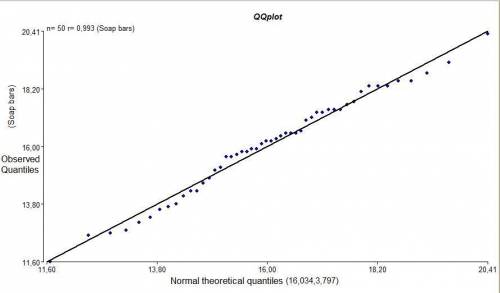
As part of a quality-control study aimed at improving a production line, the weights (in ounces) of 50 bars of soaps are measured. The results are as follows, sorted from smallest to largest.
11.6 12.6 12.7 12.8 13.1 13.3 13.6 13.7 13.8 14.1
14.3 14.3 14.6 14.8 15.1 15.2 15.6 15.6 15.7 15.8
15.8 15.9 15.9 16.1 16.2 16.2 16.3 16.4 16.5 16.5
16.5 16.6 17.0 17.1 17.3 17.3 17.4 17.4 17.4 17.6
17.7 18.1 18.3 18.3 18.3 18.5 18.5 18.8 19.2 20.3
Required:
Construct a normal probability plot for these data. Do the data appear to come from an approximately normal distribution?

Answers: 2


Other questions on the subject: Mathematics
Mathematics, 21.06.2019 18:30, lionscoachjose
Tod does not have any cookies. david gives jeff 8 cookies. then he splits half of the cookies he has left with tod. david let’s c represent the number of cookies that he starts with. he finds the number of cookies that tod has is 1/2 the difference of c and 8. write an expression to represent the number of cookies that tod has.
Answers: 2
You know the right answer?
As part of a quality-control study aimed at improving a production line, the weights (in ounces) of...
Questions in other subjects:
Mathematics, 28.07.2019 19:30

Mathematics, 28.07.2019 19:30
Mathematics, 28.07.2019 19:30

Mathematics, 28.07.2019 19:30


