
Mathematics, 09.03.2020 23:39 kirstennnash
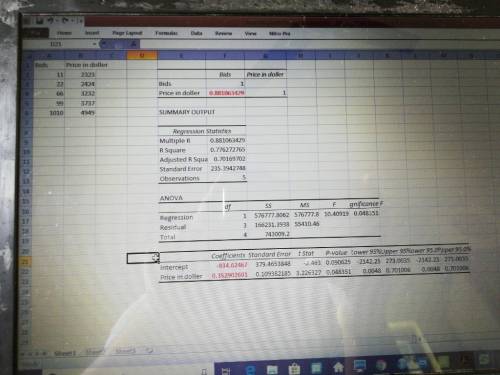
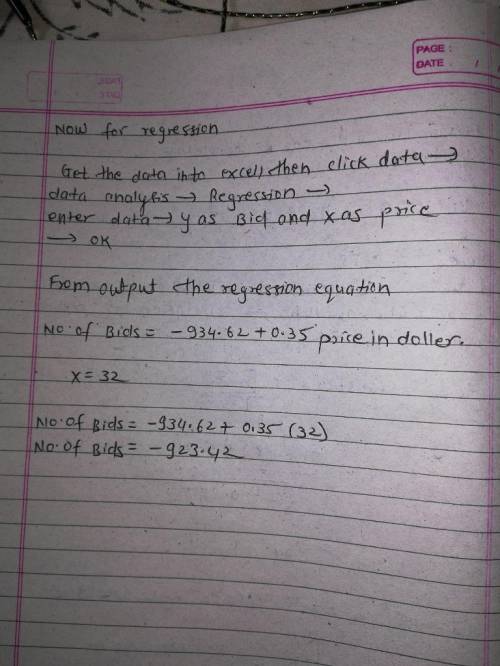
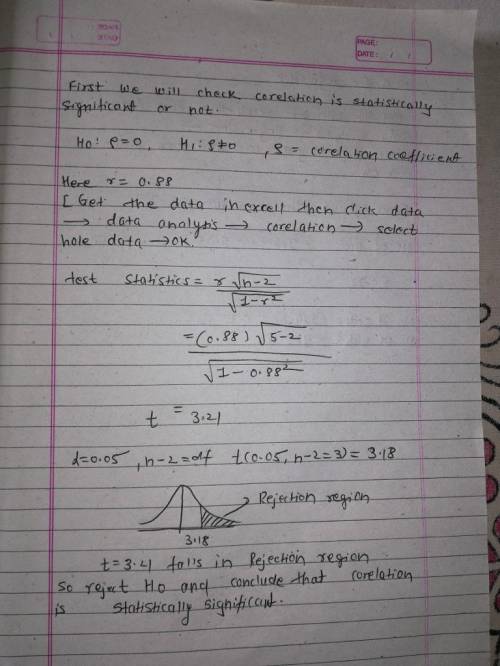
The table below gives the list price and the number of bids received for five randomly selected items sold through online auctions. Using this data, consider the equation of the regression line, yˆ=b0+b1x for predicting the number of bids an item will receive based on the list price. Keep in mind, the correlation coefficient may or may not be statistically significant for the data given. Remember, in practice, it would not be appropriate to use the regression line to make a prediction if the correlation coefficient is not statistically significant.
col1 Price in Dollars 23 24 32 37 49
col2 Number of Bids 1 2 6 9 10
Step 2 of 6: Find the estimated y-intercept =-0.488
Step 3 of 6: Determine the value of the dependent variable yˆ at x=0 is = -0.488
Step 4 of 6: Determine if the statement "Not all points predicted by the linear model fall on the same line" is False
Step 5 of 6: Substitute the values you found in steps 1 and 2 into the equation for the regression line to find the estimated linear model. According to this model, if the value of the independent variable is increased by one unit, then find the change in the dependent variable =0.290
Step 6 of 6: Find the value of the coefficient of determination =0.928

Answers: 3


Other questions on the subject: Mathematics
Mathematics, 21.06.2019 14:00, devontemiles1174
Will give brainliest if you answer question correct
Answers: 2
Mathematics, 21.06.2019 20:30, plzhelpmeasap46
Acompany produces packets of soap powder labeled “giant size 32 ounces.” the actual weight of soap powder in such a box has a normal distribution with a mean of 33 oz and a standard deviation of 0.7 oz. to avoid having dissatisfied customers, the company says a box of soap is considered underweight if it weighs less than 32 oz. to avoid losing money, it labels the top 5% (the heaviest 5%) overweight. how heavy does a box have to be for it to be labeled overweight?
Answers: 3
You know the right answer?
The table below gives the list price and the number of bids received for five randomly selected item...
Questions in other subjects:


