
Mathematics, 09.03.2020 07:30 maddie3354
Which system of inequalities does the graph represent? Which test point satisfies both of the inequalities in that system?
The graph represents the system of inequalities .
The test point satisfies both of the inequalities in the system represented by the graph.
Graph represents: 1. 4x - y is less than or equal to 4 and 2x - 2y is less than or equal to 3. 2. 4x - y is greater than or equal to 4 and and 2x - 2y is less than or equal to 3. 3. 4x - y is less than or equal to 4 and 2x - 2y is greater than or equal to 3. 4. 4x - y is greater than or equal to 4 and 2x - 2y is greater than or equal
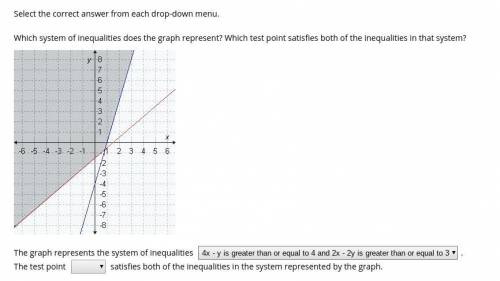

Answers: 3


Other questions on the subject: Mathematics
Mathematics, 21.06.2019 15:00, DerikF9478
Saline iv fluid bags cost $64.20 for 24, 1000 ml bags from one supplier. another supplier sells 500 ml bags for $2 each. the hospital uses about 10,000, 1000 ml bags each month. nurses report that about half of the bags are more than half full when they are discarded. if you are going to use only one supplier, which would you choose and how much would you save with that choice? show calculator try it! if you buy 1000 ml bags, how many do you need to buy each month? type your answer in the space provided and click on the check answer button.
Answers: 3
Mathematics, 21.06.2019 21:30, fheight01
Name and describe the three most important measures of central tendency. choose the correct answer below. a. the mean, sample size, and mode are the most important measures of central tendency. the mean of a data set is the sum of the observations divided by the middle value in its ordered list. the sample size of a data set is the number of observations. the mode of a data set is its highest value in its ordered list. b. the sample size, median, and mode are the most important measures of central tendency. the sample size of a data set is the difference between the highest value and lowest value in its ordered list. the median of a data set is its most frequently occurring value. the mode of a data set is sum of the observations divided by the number of observations. c. the mean, median, and mode are the most important measures of central tendency. the mean of a data set is the product of the observations divided by the number of observations. the median of a data set is the lowest value in its ordered list. the mode of a data set is its least frequently occurring value. d. the mean, median, and mode are the most important measures of central tendency. the mean of a data set is its arithmetic average. the median of a data set is the middle value in its ordered list. the mode of a data set is its most frequently occurring value.
Answers: 3
You know the right answer?
Which system of inequalities does the graph represent? Which test point satisfies both of the inequa...
Questions in other subjects:


English, 10.07.2019 16:00

History, 10.07.2019 16:00
Mathematics, 10.07.2019 16:00

Mathematics, 10.07.2019 16:00


