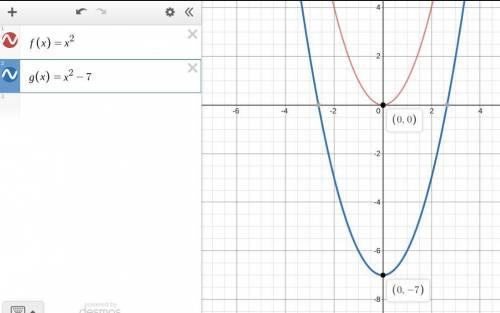
Describe how the graph of the function is related to the graph of f(x) + x^2
g(x) = x2 –...

Mathematics, 09.03.2020 02:54 janeou17xn
Describe how the graph of the function is related to the graph of f(x) + x^2
g(x) = x2 – 7

Answers: 3


Other questions on the subject: Mathematics
Mathematics, 21.06.2019 12:30, faith365
Aschool typically sells 500 yearbooks each year for 50 dollars each. the economic calls does a project and discovers that they can sell 100 more yearbooks for every $5 decrease in price. the revenue for yearbook sales is equal to the number of yearbooks sold times the price of the yearbook. let x represent the number of $5 decrease in price. if the expression that represents the revenue is written in the form r(x)=(500+ax)(50-bx). to maximize profit, what price should the school charge for the yearbooks? what is the possible maximum revenue? if the school attains the maximum revenue, how many yearbooks will they sell?
Answers: 3
Mathematics, 21.06.2019 15:00, zahradawkins2007
In a circle, a 45° sector has an area of 32π cm2. what is the radius of this circle? 32 cm 12 cm 16 cm 8 cm
Answers: 3
Mathematics, 21.06.2019 19:30, shavonfriend27
Vinay constructed this spinner based on the population of teachers at his school according to vinays model what is the probability that he will have a male history teacher two years in a row
Answers: 3
Mathematics, 21.06.2019 20:30, savannahvargas512
For g(x) = 5x - 3 and h(x) = [tex]\sqrt{x}[/tex], find (g · h)(4)
Answers: 1
You know the right answer?
Questions in other subjects:

Business, 05.07.2019 02:00

Mathematics, 05.07.2019 02:00

Computers and Technology, 05.07.2019 02:00
Biology, 05.07.2019 02:00
Mathematics, 05.07.2019 02:00
Mathematics, 05.07.2019 02:00
Biology, 05.07.2019 02:00


