
Mathematics, 07.03.2020 05:09 hhomeschool24
According to a study published in the New England Journal of Medicine, overweight people on low-carbohydrate and Mediterranean diets lost more weight and got greater cardiovascular benefits than people on a conventional low-fat diet (The Boston Globe, July 17, 2008). A nutritionist wishes to verify these results and follows 30 dieters on the low-carbohydrate and Mediterranean diets and 30 dieters on the low-fat diet. These data (measured in pounds) can be found on the text website, labeled Different Diets. Let Low-carb or Mediterranean and Low-fat diets represent populations 1 and 2, respectively. Use Table 2.
Low-carb Low-carb/
Mediterrean Diets Low- Fat diet Mediterreand diet Low-fat Diet
9.5 6.5 6.8 5.9
8.1 5.8 9.1 6.9
10.4 9.9 9.4 9.1
11.9 5.1 10.2 8.0
11.8 8.0 9.5 8.9
12.6 6.3 9.5 3.4
6.7 6.3 9.4 4.6
9.6 4.4 12.0 6.2
11.6 5.7 9.9 4.6
8.4 5.9 9.7 6.7
9.0 6.8 9.2 4.6
7.5 5.1 13.0 7.1
7.2 6.3 11.3 11.0
8.5 5.5 13.6 4.5
8.8 5.5 9.0 3.9
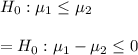
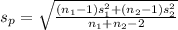
a. Set up the hypotheses to test the claim that the mean weight loss for those on low-carbohydrate or Mediterranean diets is greater than the mean weight loss for those on a conventional low-fat diet.
H0: ?1 ? ?2 ? 0; HA: ?1 ? ?2 > 0
H0: ?1 ? ?2 = 0; HA: ?1 ? ?2 ? 0
H0: ?1 ? ?2 ? 0; HA: ?1 ? ?2 < 0
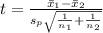
b-1.Using the appropriate commands in Excel, find the value of the test statistic. Assume that the population variances are equal and that the test is conducted at the 5% significance level. (Round your answer to 2 decimal places.)
Test statistic
b-2. What is the critical value and the rejection rule?
Reject H0 if tdf < -1.672.
Reject H0 if tdf < -2.002.
Reject H0 if tdf > 2.002.
Reject H0 if tdf > 1.672.
c. At the 5% significance level, can the nutritionist conclude that overweight people on low-carbohydrate or Mediterranean diets lost more weight than people on a conventional low-fat diet?
No
Yes
Low-carb/Mediterrean Diets Low-fat Diet
9.5 6.5
8.1 5.8
10.4 9.9
11.9 5.1
11.8 8
12.6 6.3
6.7 6.3
9.6 4.4
11.6 5.7
8.4 5.9
9 6.8
7.5 5.1
7.2 6.3
8.5 5.5
8.8 5.5
6.8 5.9
9.1 6.9
9.4 9.1
10. 2 8
9.5 8.9
9.5 3.4
9.4 4.6
12 6.2
9.9 4.6
9.7 6.7
9.2 4.6
13 7.1
11.3 11
13.6 4.5
9 3.9

Answers: 3
 versus
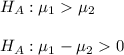

 if
if 


Other questions on the subject: Mathematics
Mathematics, 22.06.2019 00:30, kitykay2399
An unknown number x is at most 10. which graph best represents all the values of x? number line graph with closed circle on 10 and shading to the right. number line graph with open circle on 10 and shading to the right. number line graph with open circle on 10 and shading to the left. number line graph with closed circle on 10 and shading to the left.
Answers: 1
You know the right answer?
According to a study published in the New England Journal of Medicine, overweight people on low-carb...
Questions in other subjects:

Social Studies, 04.08.2019 21:00

English, 04.08.2019 21:00


Chemistry, 04.08.2019 21:00

Spanish, 04.08.2019 21:00
Physics, 04.08.2019 21:00

Chemistry, 04.08.2019 21:00

Biology, 04.08.2019 21:00


