
To prepare for an upcoming basketball tournament, Coach Somers keeps track of the number of
po...

Mathematics, 06.03.2020 22:32 michaelcarroll4228
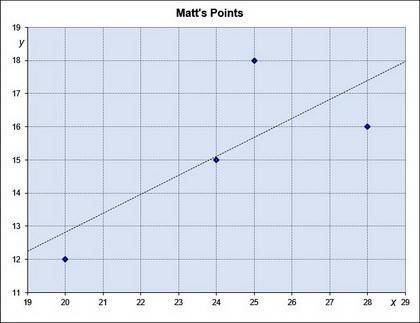
To prepare for an upcoming basketball tournament, Coach Somers keeps track of the number of
points scored by each player on the team for various minutes played during the most recent five
games. The results for Matt, one of the players, are as follows: In one of game Matt scored 12
points in 20 minutes. In another game he scored 16 points in 28 minutes. Matt then scored 15
points in a game where he played a total of 24 minutes. Finally, Matt scored 18 points during a
game where he played for 25 minutes. Using x to represent the number of minutes and y to
represent the number of points scored, create a graph to represent this relation.

Answers: 1


Other questions on the subject: Mathematics
Mathematics, 22.06.2019 01:30, alyssaboosiefkes
Im so bad at fractions they are not my best math thing to work on
Answers: 3
You know the right answer?
Questions in other subjects:

History, 30.11.2020 22:50
Mathematics, 30.11.2020 22:50


Spanish, 30.11.2020 22:50

Biology, 30.11.2020 22:50


