Mathematics, 05.03.2020 17:19 Brangolflro
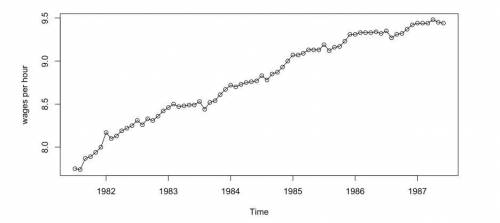
The data file wages contains monthly values of the average hourly wages (in dollars) for workers in the U. S. apparel and textile products industry for July 1981 through June 1987.
a. Display and interpret the time series plot for these data.
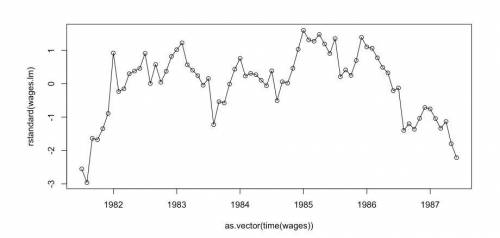
b. Use least squares to fit a linear time trend to this time series. Interpret the regression output. Save the standardized residuals from the fit for further analysis.
c. Construct and interpret the time series plot of the standardized residuals from part (b).
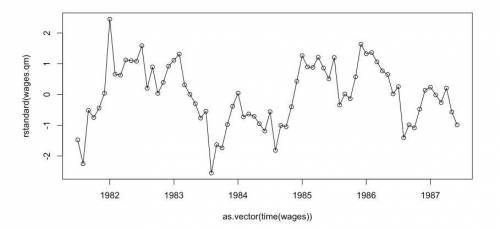
d. Use least squares to fit a quadratic time trend to the wages time series. (i. e y(t)=βo+β1t+β2t^2+et). Interpret the regression output. Save the standardized residuals from the fit for further analysis.
e. Construct and interpret the time series plot of the standardized residuals from part (d).

Answers: 3


Other questions on the subject: Mathematics

Mathematics, 21.06.2019 15:20, aliceotter2007
Asmall (but heavy) particle placed in a glass of water will follow a zigzag motion because the particle will bounce off of the water molecules it meets. this is called brownian motion. a physicist simulates this on a computer, by varying the distance a particle can travel (called the mean free length), on average, before it collides with a water molecule and assigning the change in motion to be one of 8 directions, each with a similar probability. by running the simulated particle (with the same mean free length) many times she determines that it should take 15 seconds, on average, for the particle to fall to the bottom, with a standard deviation of 1.5 seconds. next she lets a real particle fall through a glass of water and finds that it took 18 seconds. what does she conclude, and why?
Answers: 1


Mathematics, 21.06.2019 19:10, gurlnerd
1jessica's home town is a mid-sized city experiencing a decline in population. the following graph models the estimated population if the decline continues at the same rate. select the most appropriate unit for the measure of time that the graph represents. a. years b. hours c. days d. weeks
Answers: 2

Mathematics, 21.06.2019 23:30, xxaurorabluexx
Pleting the square f the given find the x-intercepts of the parabola with vertex (-5,13) and y-intercept (0, 12). write your answer in this form: (14,.99). if necessary, round to the nearest hundredth. *- h enter the correct answer, de verter, and ametry 00000 done doo
Answers: 2
You know the right answer?
The data file wages contains monthly values of the average hourly wages (in dollars) for workers in...
Questions in other subjects:


Mathematics, 02.02.2021 20:10

English, 02.02.2021 20:10

Chemistry, 02.02.2021 20:10


Mathematics, 02.02.2021 20:10

Biology, 02.02.2021 20:10

Biology, 02.02.2021 20:10


