
Mathematics, 05.03.2020 05:12 alayjared12374
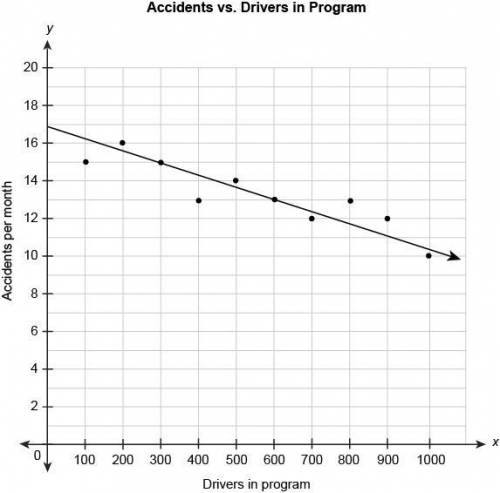
The scatter plot shows the relationship between the number of car accidents in a month and the number of drivers attending a program on distracted driving. The equation represents the linear model for this data.
y=−0.0067x+17
What does the number -0.0067 in the equation mean in this context?
The number of accidents was reduced by 0.67 per month for every additional driver in the program.
The number of accidents increased by 0.67 per month for every additional 100 drivers in the program.
The number of accidents was reduced by 0.67 per month for every additional 100 drivers in the program.
There were 0.67 accidents per month.
The number of accidents was reduced by 0.67 per month every month.

Answers: 1


Other questions on the subject: Mathematics
Mathematics, 21.06.2019 19:30, allicat133
Awater holding tank measures 105 m long, 50 m wide, and 8 m deep. traces of mercury have been found in the tank, with a concen- tration of 60 mg/l. what is the total mass of mercury in the tank? answer in units of kg.
Answers: 1
Mathematics, 21.06.2019 20:30, Gabyngreen
What is the interquartile range of this data set? 2, 5, 9, 11, 18, 30, 42, 48, 55, 73, 81
Answers: 1
Mathematics, 22.06.2019 00:00, heyyyyy117
Define the type of sequence below. 7, 14, 28, 56, 112, a. neither arithmetic nor geometric b. arithmetic c. both arithmetic and geometric d. geometric
Answers: 1
You know the right answer?
The scatter plot shows the relationship between the number of car accidents in a month and the numbe...
Questions in other subjects:

Mathematics, 29.04.2021 22:10

English, 29.04.2021 22:10
Biology, 29.04.2021 22:10
English, 29.04.2021 22:10
Mathematics, 29.04.2021 22:10

History, 29.04.2021 22:10


